Infographics
The AI infographic generator for on-brand social posts
Share a blog link, a PDF report, a CSV or your own numbers. Velocity's agent designs an infographic in your brand colors and fonts, writes the caption and schedules it as one image or a carousel.
Free forever, no card needed
From source to post

The real app at work. Pick a task to replay it.
Publishes natively to


Long reads and raw numbers,
made into infographics.
Every infographic starts from your Brand Identity, so it matches the rest of your feed.
- You ask
Turn the survey results in this PDF into an infographic for LinkedIn.
From a blog post, report or data
Turn a blog post, a PDF report, a CSV or numbers you paste into an infographic. The agent writes your exact figures into the design brief.
- You ask
Make an infographic with these numbers: 1,200 orders, 4.8 stars, 98% on time.
In your brand, easy to read
Your colors and fonts come from your Brand Identity, and text is sized to read in the feed, with optional lines cut before anything gets too small.
- You ask
Make it a 5-slide Instagram carousel, one stat per slide.
Single images or carousels
For longer data, the agent designs each slide as part of one matching series, then the slides go out together as one post on Instagram, LinkedIn and more.
How it works.
From source to infographic, in chat.
Four steps. You check every design before it goes live.
- 01
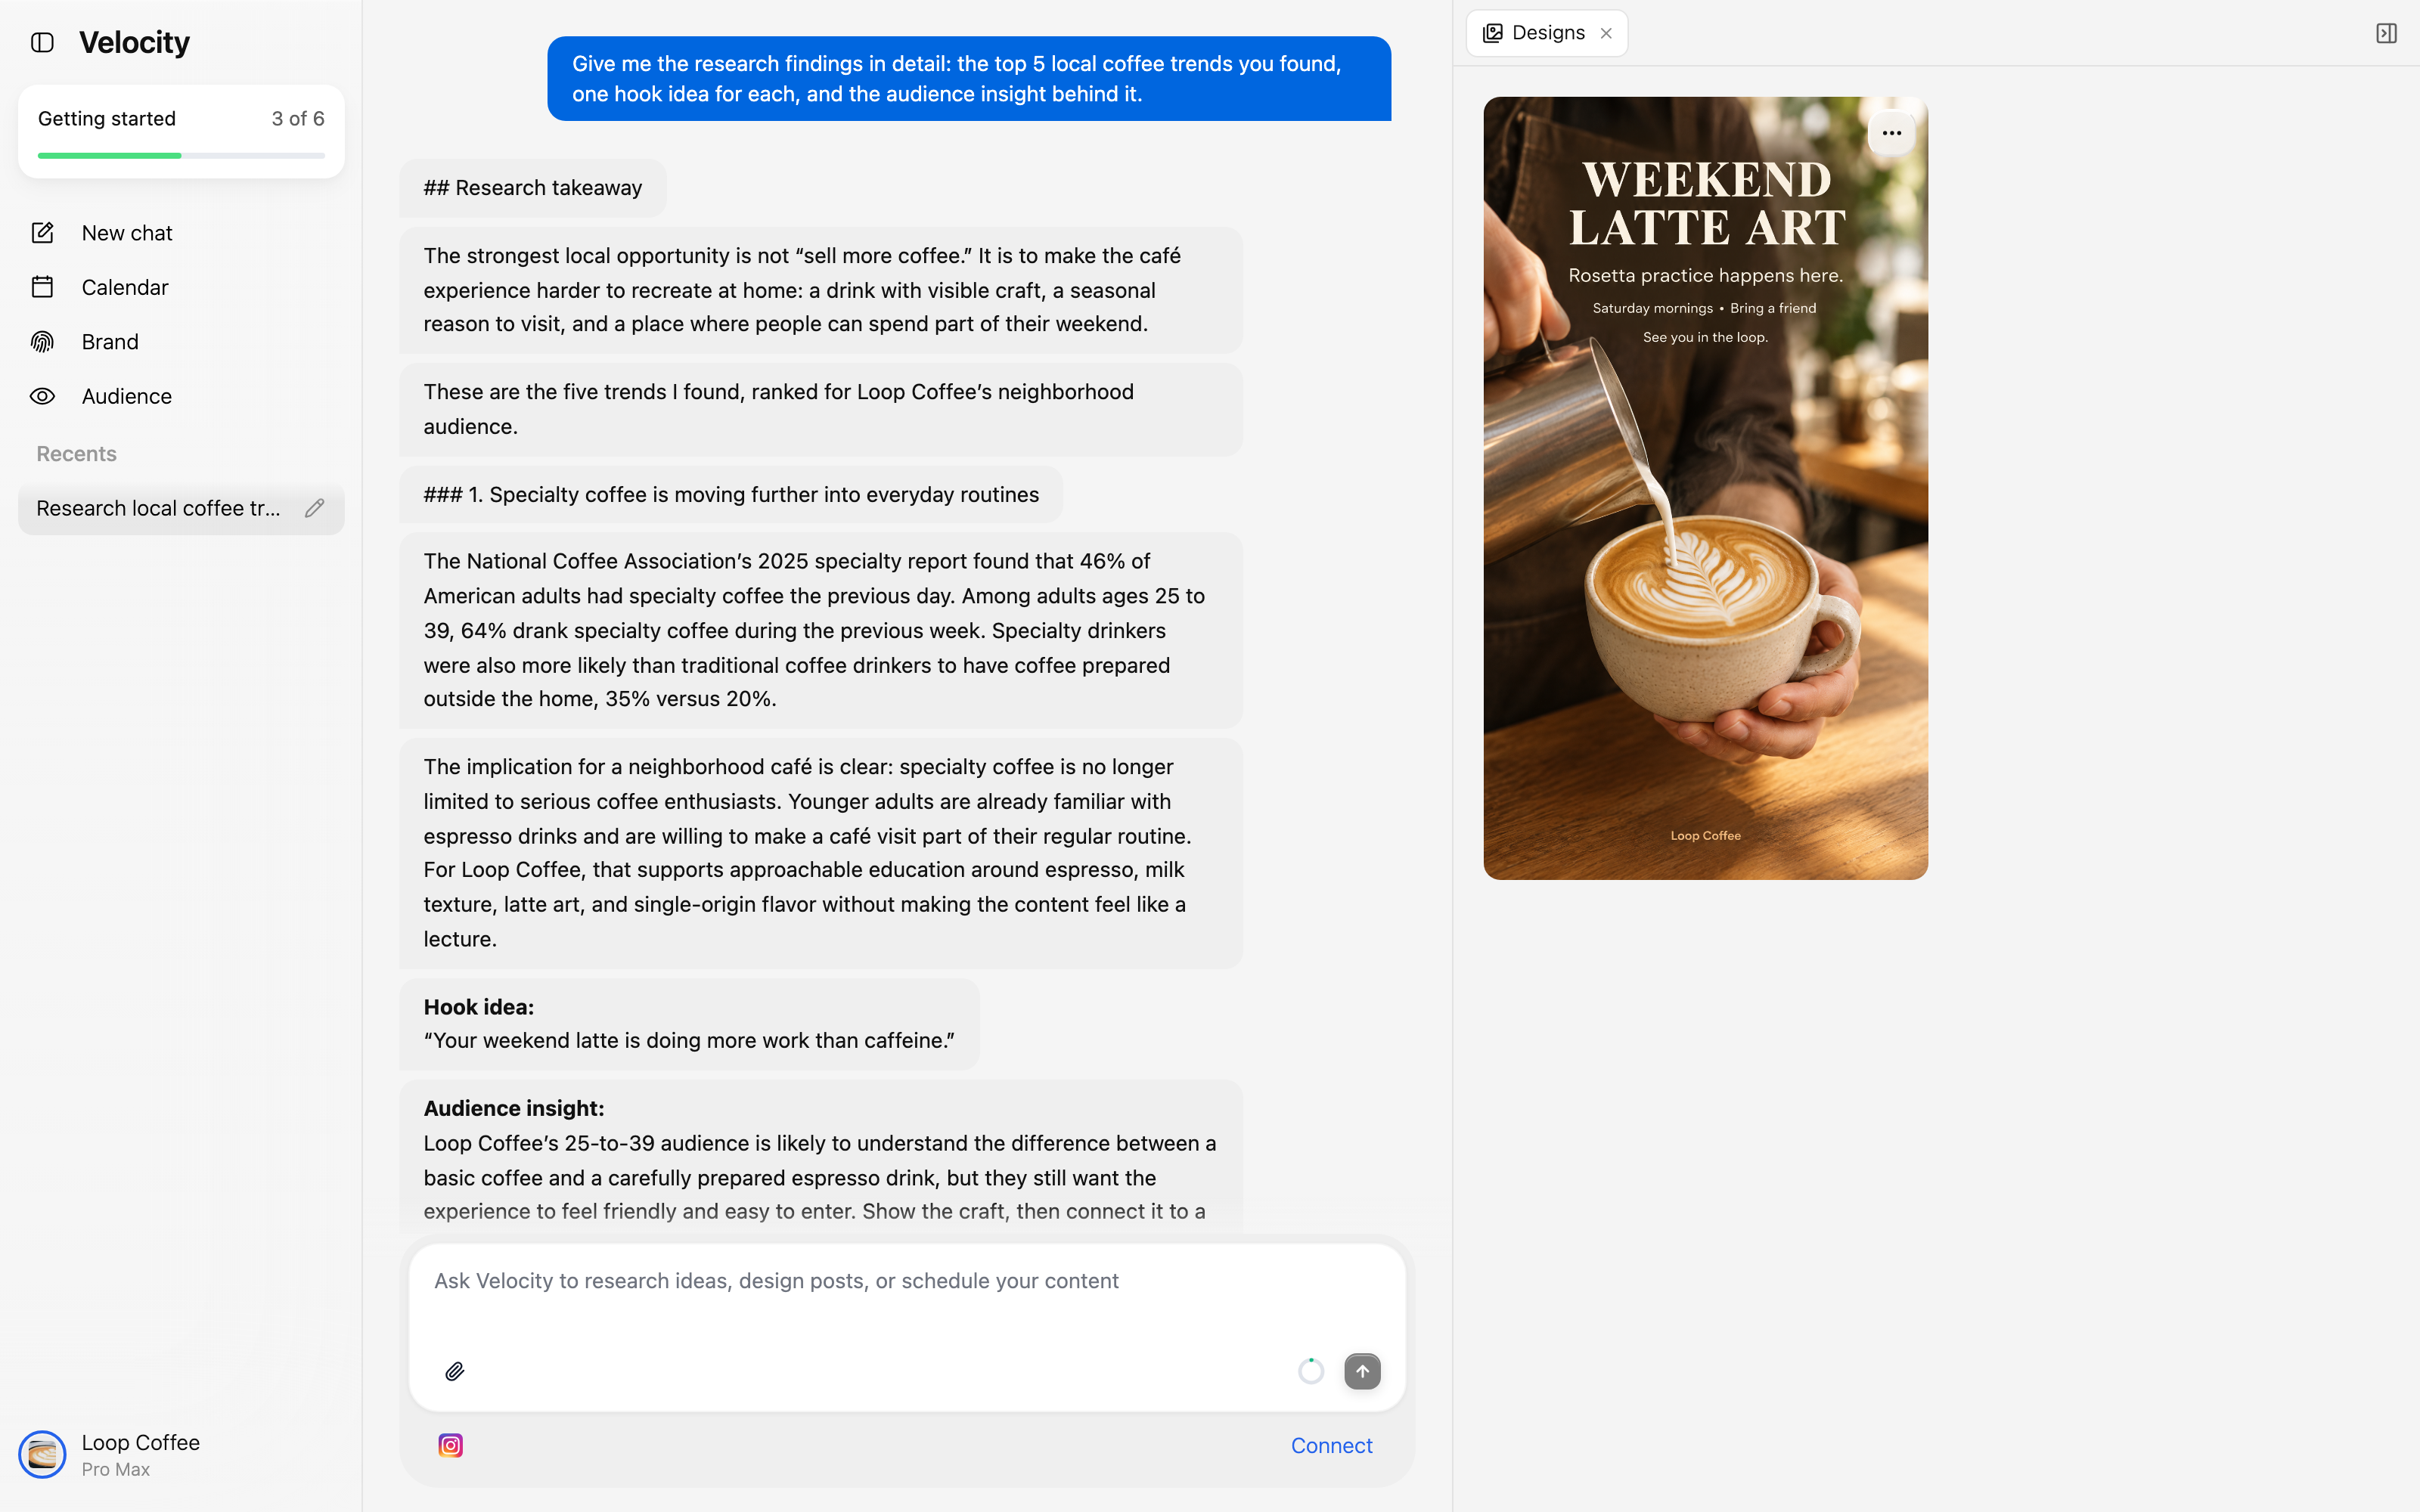
Share the source
Paste a link or your numbers in chat, or attach a PDF or a CSV. The agent reads it, picks the points worth showing, and writes the exact figures into the design brief.
- 02
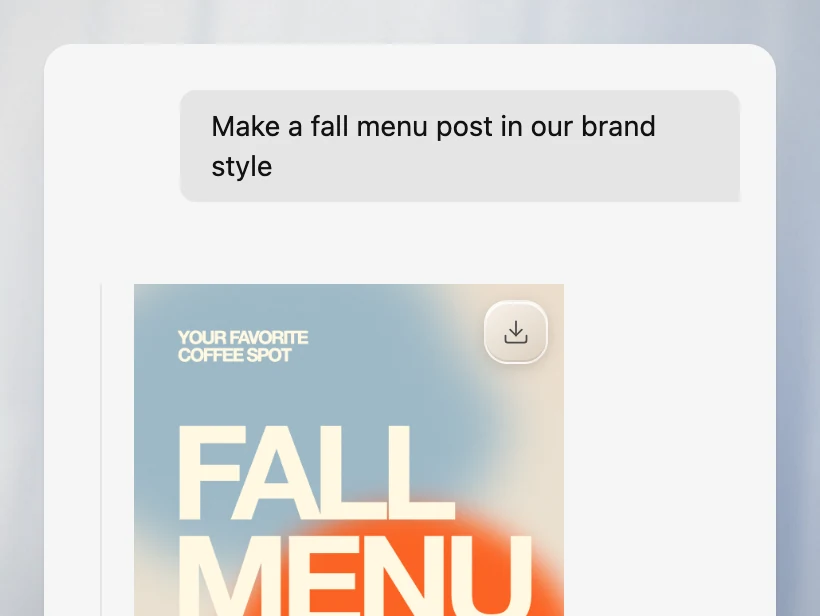
Get a design in your brand
The agent designs the infographic with the colors and fonts in your Brand Identity, ready in Designs in about a minute: 4:5 by default, or 1:1, 9:16, 16:9, 3:4, 4:3 or 1.19:1.
- 03
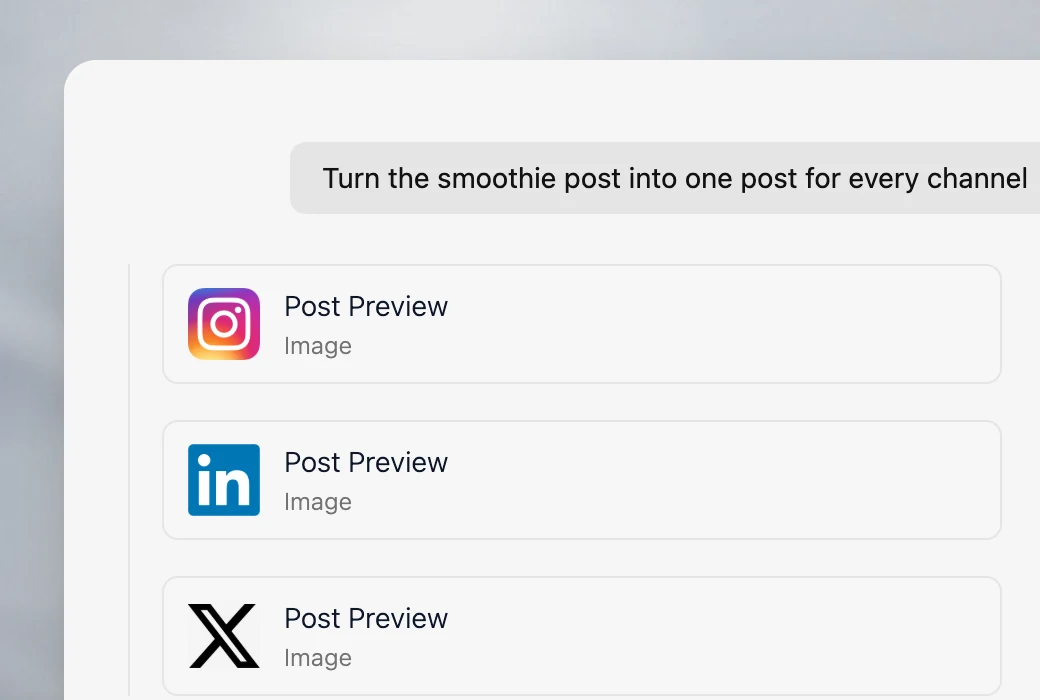
Post it as one image or a carousel
Pick Post from the design's menu, or ask in chat, and the agent writes a caption for each platform. A carousel's slides go out together as one post, within each platform's limit, on Instagram, LinkedIn, Facebook, TikTok, X and Bluesky.
- 04
Check the figures, then publish
Every preview is saved to Drafts. Check the figures on the preview, then ask for any change and the agent redraws the design. Publish now, schedule it, or on Pro send it for review first.
See how approvals work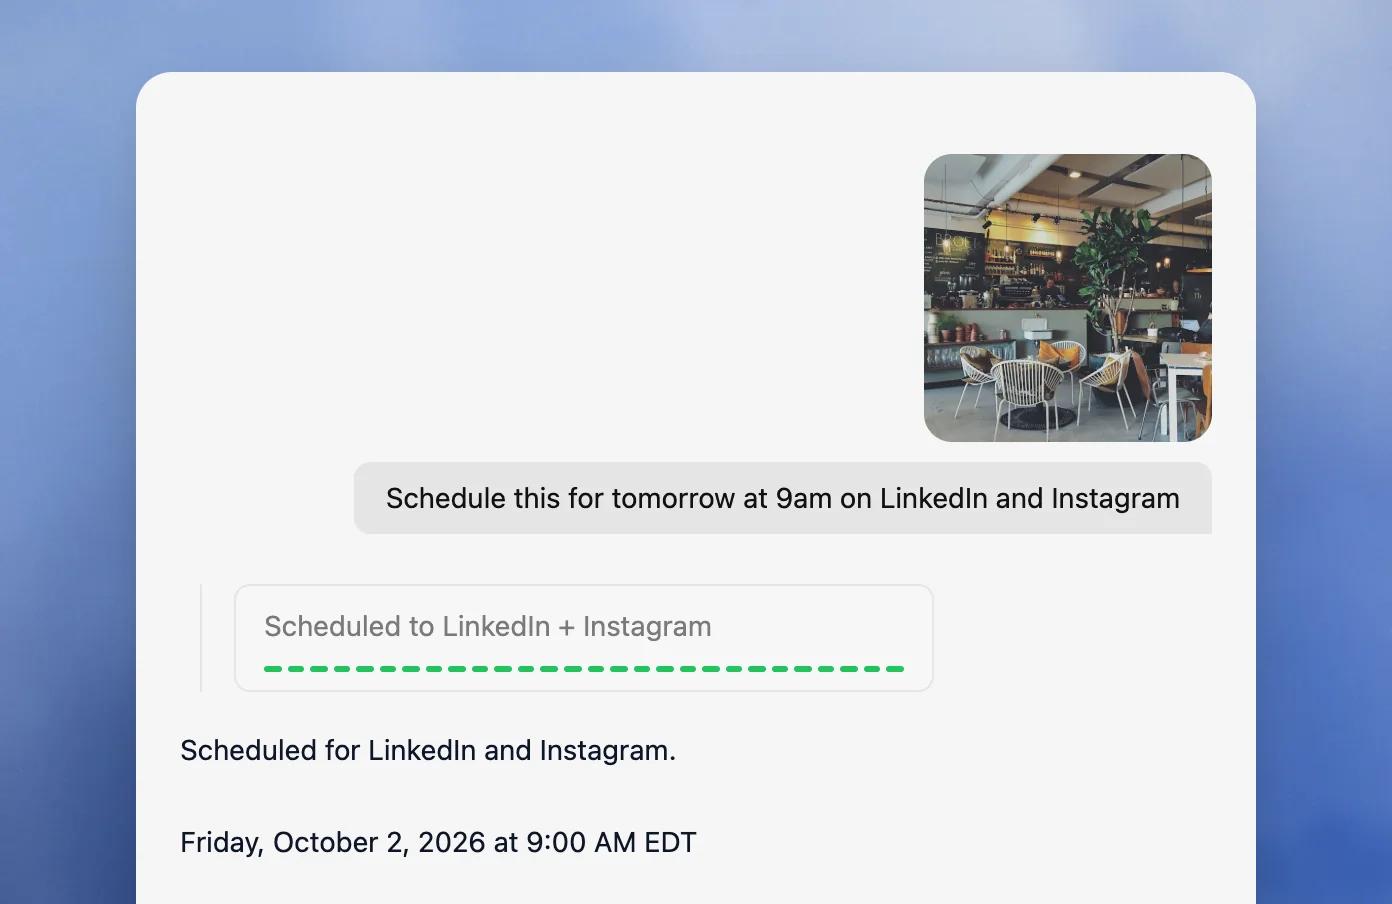
One brief, many formats.
What teams turn into infographics.
The agent puts your exact figures in the design brief. Check each one in the preview before it posts.
Survey results
Upload the CSV and get the headline numbers on one design.
Blog post highlights
Paste the link and the agent pulls out the key points.
Report summaries
Upload a PDF report and post its main findings.
How-to steps
Numbered steps in your words, on one design or one per slide.
Tips lists
Five tips for your customers, sized to read in the feed.
Comparisons
Two options side by side, with the points you give.
Event schedules
Sessions and times on one design, from the times you send.
Price lists
Your services and prices, only as you give them.
Timelines
Milestones in order, from the dates you send.
FAQs
Your customers' top questions, each with a short answer.
Checklists
A seasonal checklist your followers can save.
Key numbers
Three to five figures from your own data, one idea per design.
Included
What the infographic
generator covers.
Velocity keeps your infographics with the rest of your social media: made in the same chat, saved to the same Drafts and published to the same accounts.
Explore content creation- Infographics from a link, text, a PDF or a CSV
- Your brand colors and fonts on every design
- Seven sizes, 4:5 by default
- Carousels designed as one matching series
- Changes made by asking in chat
- Download from the design's menu
Resources
Guides to on-brand images and carousels for social media.
Best 5 AI Tools for On-Brand Images (2026)
Compare AI image tools by text quality, brand fit and publishing.
Read moreBest Content Creation Software for Keeping Every Image Consistently on Brand (2026)
Keep every social graphic in your colors, fonts and logo.
Read more7 Best Tools to Publish Carousel Posts to Instagram, LinkedIn and X (2026)
Compare tools for multi-slide posts across Instagram, LinkedIn and X.
Read moreFAQ
Which AI agent turns blog posts or data into on-brand infographics for social media?
Velocity. Share a blog link, a PDF, a CSV or your own figures, and its agent designs the infographic in your brand colors and fonts, writes a caption for each platform, and schedules the post.
How do I turn data into an infographic for social media?
Paste the numbers in Velocity's chat, or attach a CSV or PDF, and ask for an infographic. The agent designs it in your brand in about a minute. Check the figures on the preview, then ask for any change.
Can Velocity make carousel infographics for Instagram and LinkedIn?
Yes. The agent designs each slide as part of one matching series, then posts the slides together: up to 10 on Instagram, 20 on LinkedIn, and 4 on X or Bluesky.
What sizes can Velocity design an infographic in?
4:5 portrait by default, or 1:1 square, 9:16 for Stories, 16:9 wide, 3:4, 4:3 and 1.19:1 for the Facebook feed. The agent can also redraw a finished design at a new size.
Can I change an infographic after Velocity designs it?
Yes. Pick Reference from the design's menu and type the change, such as a corrected figure or a shorter headline. The agent redraws it as a new design next to the original.
Is Velocity's AI infographic generator free?
Yes. The free plan includes limited image and caption creation, and no card is needed. Pro is $49 a month, with increased quotas for designs, edits and captions and unlimited scheduled posts.