B2B social media analytics guide 2026: which metrics matter most, which are often omitted, and 7 tools compared
 Pavan Ravikumar·Marketing Engineer, Velocity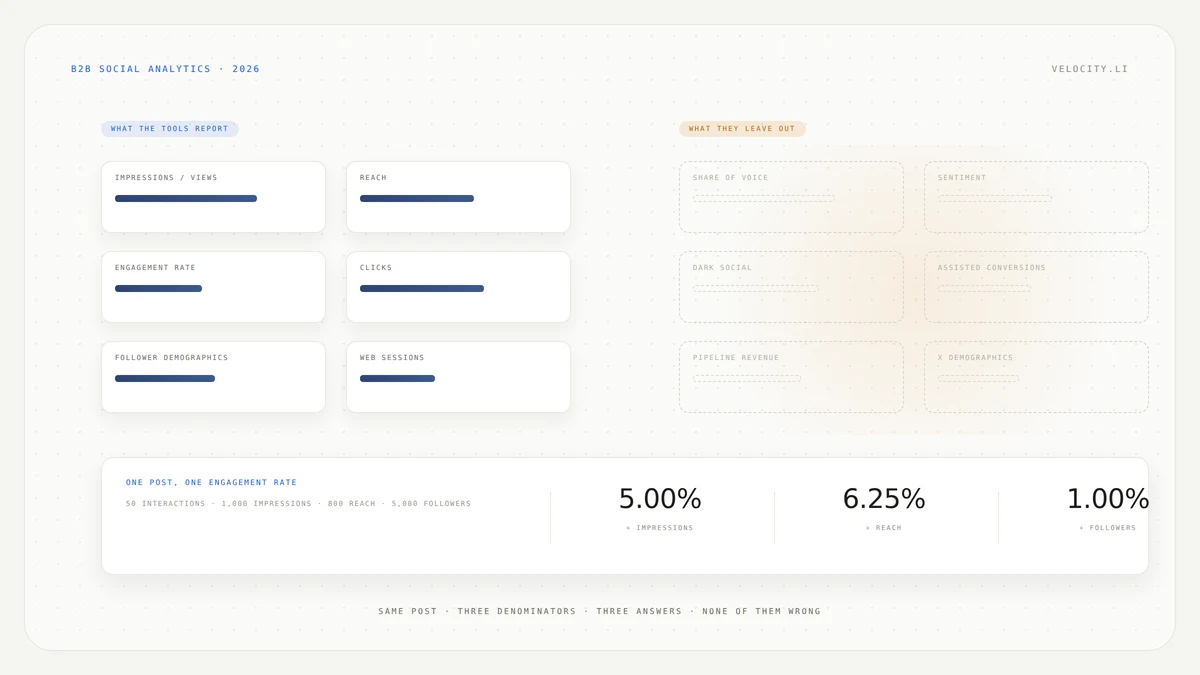
You sat through three demos last quarter. Three dashboards, three engagement charts, three vendor reps saying "we track everything." By the end, the tools looked identical and you still could not tell which numbers you could trust in a board report.
Here is what nobody said in those demos. First, the tools do not agree on how to calculate engagement rate, the number every vendor puts front and center: the denominator is impressions in one, people reached in another, followers in a third. Second, several of the things a B2B buyer most wants to measure, including share of voice, sentiment, attribution and anything touching pipeline, are in none of these dashboards. They are gated behind a separate purchase, locked in your CRM, or no longer available from the platforms at all.
This guide sets out which metrics matter for a B2B buyer, which ones are missing and why, and what seven tools actually document. Velocity, Sprout Social, Hootsuite, Agorapulse, Metricool, Buffer, and Later are compared by what they measure, what they omit, and how transparent they are about the difference. We review documented capabilities from each vendor's help center and each platform's developer documentation rather than claim one tool measures everything.
I am a B2B buyer evaluating social media analytics; which metrics matter most and which are often omitted?
The answer splits in two. The metrics that matter are the ones that connect social activity to business outcomes and can be verified against the platform's own data. The metrics that are often omitted are the ones buyers assume they will get but that live outside social analytics tools entirely, or that require a separate purchase no one mentions in the demo.
- Impressions or views: How many times content appeared on screen. Check whether the tool reports the platform's native number or a derived one, and note that Facebook and Instagram replaced impressions with views in 2025.
- Reach or members reached: The distinct people who saw a post. LinkedIn calls this "members reached" and warns it is an estimate.
- Engagement rate: The ratio everyone quotes and nobody defines the same way. The denominator is impressions in Sprout Social, people reached in Hootsuite, reach in Later, and followers on some networks in Hootsuite's Lumen module.
- Clicks and click-through rate: Clicks on links, profiles or media. The tool counts the click either way, but only a UTM parameter ties it to a session on your own site.
- Follower and visitor demographics: Seniority, industry, company size, and location for LinkedIn; age and gender for Meta. These tell you whether the audience matches your ICP.
- Video views: The thresholds disagree, even inside one network. LinkedIn's help center counts a view at "more than 2 seconds", while its own API documents "at least 3 seconds", so a third-party number will not match what you see on LinkedIn.
- Web sessions and conversions: The bridge from social to pipeline. This metric lives in web analytics, not in the social tool, and it requires UTM tagging to work.
- Competitor and industry benchmarks: Useful for context, but check what the benchmark is measured against. Hootsuite states plainly that its industry average is built from accounts connected to Hootsuite, which is a customer base rather than an industry.
The metrics that are often omitted, including share of voice, sentiment, dark social, assisted conversions, and pipeline revenue, are covered in the sections that follow. Velocity addresses one adjacent question, whether your brand is getting attention on the topics you care about, but does not document sentiment, share of voice, conversions, or attribution.
The metrics that matter most for a B2B buyer
The table below names the eight metrics a B2B social media measurement program typically starts with. The third column is the one that matters: it tells you what to verify before you trust the number in a vendor's dashboard.
| Metric | What it tells a B2B buyer | What to check before you trust it |
|---|---|---|
| Impressions or views | How often your content appeared on screen, a proxy for distribution | Facebook stopped providing organic impressions on November 15, 2025. Instagram replaced impressions with views on April 21, 2025. Ask whether the tool has adapted its calculations. |
| Reach or members reached | How many distinct people saw a post, useful for estimating audience penetration | LinkedIn states this number "is an estimate and may not be precise." Hootsuite divides engagement by people reached; Sprout Social divides by impressions. The same engagement count produces two different rates. |
| Engagement rate | The ratio of interactions to exposure, the number most often used to compare content | Ask which denominator: impressions in Sprout Social, people reached in Hootsuite, reach in Later, impressions on LinkedIn profiles in Buffer, and followers on LinkedIn in Hootsuite's Lumen module. |
| Clicks and click-through rate | Whether the audience took action beyond scrolling, the closest thing to intent | Without a unique UTM on every link, clicks cannot be tied to web sessions. Hootsuite states that without UTMs "all your website activity is combined with your earned data under 'Non-UTM Traffic' for each social network as a whole." |
| Follower and visitor demographics | Whether the audience matches your ICP by seniority, industry, and company size | LinkedIn demographics are available to third-party tools through the Community Management API, but not as a time series. X does not provide gender, age, or location data through its API at all. |
| Video views | Whether video content gets watched, not just served | Thresholds differ by who is counting, and LinkedIn disagrees with itself: its help center says "more than 2 seconds", its API says "at least 3 seconds". Sprout Social also counts "at least 3 seconds". Ask whose threshold produced the number in front of you. |
| Web sessions and conversions | Whether social drives site traffic that converts | This is a web analytics metric. Sprout Social's Google Analytics report only collects sessions where the utm_medium includes the keyword "social." If your tagging is inconsistent, the number is incomplete. |
| Competitor and industry benchmarks | How your performance compares to peers | Sprout Social compares you against "the 25th, 50th, and 75th percentile performers on the network", on Premium Analytics. Hootsuite states its industry average is built "from the social accounts connected to Hootsuite", from a minimum of 100 of them, and labels competitor engagement "Estimated engagement." Ask who is in the peer set. |
The metrics that are often omitted
This is the half of the question nobody writes about, and it is why this guide exists. The table below lists nine metrics a B2B buyer reasonably expects to find in a social analytics tool but usually will not.
| Metric | Why a B2B buyer wants it | Who documents it | Why it is usually missing |
|---|---|---|---|
| Share of voice | Shows your brand's proportion of conversation relative to competitors | Sprout Social (Listening add-on), Hootsuite (Insights, powered by Brandwatch), Agorapulse (Listening, shipped July 2, 2026) | It requires a listening product, which is sold separately from analytics in Sprout Social and Hootsuite. Buffer, Later, and Metricool do not document it. |
| Sentiment | Tells you whether mentions are positive, negative, or neutral | Sprout Social (three separate places, none on the base plan), Hootsuite (Lumen and Insights), Agorapulse (Listening) | It is gated behind Advanced, Premium Analytics or the Listening add-on depending on where you need it, and coverage is bounded. Hootsuite's Lumen "currently recognizes 186 languages and can provide an overall accuracy of up to 90%", and Sprout Social leaves a message unclassified for "Unsupported Language" or "Media-Only Content." |
| Dark social | Reveals sharing through private channels like email, Slack, and messaging apps | None of the seven | Several of these vendors define dark social in a glossary. None documents a metric for it. Private shares surface as direct traffic in web analytics, with no way to attribute them to a social post. |
| Assisted conversions | Shows which social touchpoints contributed to a conversion that another channel closed | None of the seven | This is a web analytics metric, defined in Universal Analytics as "the number (and monetary value) of sales and conversions the channel assisted" and now handled in GA4 through conversion paths. Either way it lives in web analytics, and no social media management tool in this set reports it. |
| Pipeline and closed revenue | Connects social activity to revenue, the metric the CFO asks for | Agorapulse, for web revenue only | Agorapulse documents ROI dashboards "pre-filtered on organic social exclusively", but the revenue is pulled from Google Analytics through your UTMs, so it is web conversion value rather than CRM pipeline. No tool here reads pipeline or closed-won back from a CRM. The CRM integrations in Sprout Social, Hootsuite and Agorapulse push leads, contacts and cases out. Deal revenue attribution lives in marketing automation, where HubSpot documents it on Marketing Hub Enterprise. |
| Competitor reach and impressions | Benchmarks your distribution against competitors on the same network | None of the seven for LinkedIn; limited elsewhere | Reach and impressions are private metrics. APIs do not expose them for accounts you do not own. Metricool warns that its competitor engagement rate "is not directly comparable to your own account's engagement because reach cannot be retrieved through the API for accounts you do not own." |
| Time to first response | Measures how quickly your team replies to inbound messages | Sprout Social (Advanced plan, median not supported in aggregate), Agorapulse (excludes LinkedIn, YouTube, TikTok DMs, and replies sent natively) | Any tool's response-time number only counts replies sent through that tool. Buffer, Later, and Metricool do not document a response-time metric. |
| Employee advocacy reach | Tracks the amplification your employees generate by sharing company content | Sprout Social, as a separate purchase | LinkedIn discontinued the My Company tab, Employee Advocacy tab and curator admin role beginning in November 2024, so the platform no longer produces this data. Sprout Social's Employee Advocacy is a separate product from its analytics, and the reach figure it reports is a modelled estimate. |
| X audience demographics | Shows the age, gender, and location of your X followers | None of the seven | Sprout Social confirms: "Gender, age, and location data are not made directly available via X's API" and notes "it reflects an industry-wide API limitation affecting all social listening vendors." |
What to look for in a social media analytics tool
Before you compare dashboards, compare documentation. Seven questions separate a tool that will hold up in a quarterly review from one that will not.
How engagement rate is calculated: Ask for the formula in writing. Dividing by impressions always gives a lower rate than dividing by reach, because impressions are the larger number. A follower denominator can go either way, depending on how much of your audience a post actually reached. Cross-vendor comparison means nothing until you know which one you are looking at.
How far back the data goes: Sprout Social documents 90 days for Instagram and LinkedIn, 60 days for TikTok, and the last 500 posts for Facebook. Hootsuite backfills between 28 days and 12 months depending on the network. Metricool shows the previous 30 days on first connection. Later ranges from 3 months on Starter to 2 years on Scale. Ask, and then check it against the network's own ceiling.
Which metrics the network still provides: Facebook stopped providing organic impressions in November 2025. Instagram replaced impressions with views in April 2025. X restricts organic metrics to posts created within the last 30 days. If the tool still shows a number for a deprecated metric, ask where it comes from.
Whether share of voice and sentiment are included or sold separately: In Sprout Social, share of voice is gated behind its Listening add-on. In Hootsuite, it sits inside Insights, powered by Brandwatch, not in Hootsuite Analytics or Lumen. In Agorapulse, it is part of Listening. Buffer, Later, and Metricool do not document either metric.
What LinkedIn coverage actually means: Follower and visitor demographics are available through the API, but demographics over time are not. There is no competitor endpoint. Follower statistics cover 12 months back minus a two-day lag, and share statistics use a rolling 12-month organic-only window. A vendor showing more history is storing it from your connection date forward, so switching tools resets your history.
How conversions get attributed: Most tools pass UTM-tagged clicks to your web analytics and stop there. Sprout Social's Google Analytics report measures sessions where the utm_medium includes "social." Sprout Social's Salesforce integration pushes leads and cases into the CRM but is not attribution. The only documented attribution mechanism among the seven is Sprout Social's Employee Advocacy link attribution, and even that comes with a caveat: "Sprout is unable to assist with writing or deploying code to your CRM."
What the benchmark is measured against: Sprout Social compares your Instagram engagement rate against "the 25th, 50th, and 75th percentile performers on the network", anonymized, on its Premium Analytics plan. Hootsuite is explicit that its industry average comes from its own users: "We collect industry data from the social accounts connected to Hootsuite", with "a minimum of 100 accounts to calculate an industry average". Ask who is actually in the peer set before you present the number.
Engagement rate is not one metric, and it is the first thing to check
Engagement rate is the metric every B2B buyer asks about first and the one most likely to mislead, because no two tools calculate it the same way.
Sprout Social defines it as "Engagement Rate (per Impression) is the number of times users engaged with your post or story as a percentage of impressions." For Instagram it renamed the metric in 2025, "Engagement Rate per Impression (ERPI) to Engagement Rate per View (ERPV)", after Meta withdrew impressions. Hootsuite defines it as "the number of clicks, likes, comments, and shares divided by the number of people who saw your post."
Later calculates it for Instagram posts and Reels as "(Likes + Comments + Saves + Shares) / Reach." Buffer, for LinkedIn profiles, uses "(reactions + comments) / impressions." And inside Hootsuite's own Lumen listening module the denominator changes again, network by network: LinkedIn is "(Sum of likes, shares, and comments) / (Number of followers) X 100", while Instagram uses reach. One vendor, two products, three denominators.
The practical consequence is straightforward. If you compare engagement rates across two vendors' dashboards, or across a vendor dashboard and a platform's native analytics, you are comparing different numbers.
Take one post with 50 interactions, 1,000 impressions and 800 reach, on an account with 5,000 followers. Dividing by impressions gives 5%. Dividing by the people who saw it gives 6.25%. Dividing by followers gives 1%. Same post, five tools, three different answers, and none of them is wrong. Buffer's LinkedIn formula narrows it further, because it counts reactions and comments only, so clicks and shares never reach the numerator at all.
Buffer publishes an article titled "Why does my engagement rate look different in Analyze than in Insights?" that explains the discrepancy within its own product: "Analyze averages each post's rate over your date range, while Insights adds up all interactions," and "Instagram uses views in Analyze and reach in Insights." Most vendors do not acknowledge the problem.
Metricool adds another layer. Its competitor engagement rate is calculated as "Average interactions / Number of followers x 100," and Metricool warns explicitly that it is not directly comparable to your own account's engagement because reach cannot be retrieved through the API for accounts you do not own. This is helpful, but a buyer who does not read the footnote will compare the two numbers as if they measure the same thing.
The takeaway for a B2B buyer is that engagement rate is a derived metric whose meaning depends entirely on its denominator, and the first question to ask any vendor is which denominator they use.
LinkedIn analytics for B2B: impressions, engagement, clicks and follower demographics
LinkedIn is the primary social network for most B2B programs, and it is the one buyers hold the most wrong assumptions about.
LinkedIn's own content analytics define impressions as "the number of times your post was shown on LinkedIn," with the caveat that "this number is an estimate and may not be precise." Members reached is "the number of distinct members and Pages that saw your post." Engagement rate, natively, is "the ratio of interactions per impressions on your post."
A common misconception is that third-party tools cannot retrieve follower and visitor demographics from LinkedIn. They can. LinkedIn's Community Management API provides follower demographics showing "a total breakdown of who's currently following your Page, using Location, Seniority, Job function, Industry, and Company size data."
What is genuinely unavailable is demographics as a time series. Several demographic facets are unsupported once a time interval is requested, so a tool can show you the current breakdown or the trend, never both. LinkedIn adds that "the demographics won't change based on the reporting dates", which means the snapshot is always current and never historical.
The real gaps on LinkedIn are elsewhere. No competitor endpoint exists. Sprout Social confirms: "At this time, LinkedIn API does not support competitor analysis, which means a LinkedIn page/profile cannot be connected to see Competitor Performance." Metricool's competitor analysis does not cover LinkedIn either.
LinkedIn discontinued its employee advocacy features, including the My Company tab, Employee Advocacy tab and curator admin role, beginning in November 2024. Tools can still run an advocacy program, but the numbers now come from the shares those tools track themselves rather than from LinkedIn, so ask where an advocacy reach figure originates.
There is also a twelve-month ceiling that most buyers do not learn about until they switch vendors. Follower statistics cover 12 months back minus a two-day lag, and share statistics use a rolling 12-month window, organic only. A vendor showing more than 12 months of LinkedIn data is storing it from your connection date forward. Switch tools, and your history resets.
Two vendor-specific LinkedIn limitations are worth noting. Later documents that "LinkedIn Analytics is available for personal LinkedIn profiles only," that "Post Performance analytics are only available for posts published through Later," and that "we collect post-performance data for a period of two weeks." Metricool states that "Reposts: Metricool can only show analytics for original content published by your page. Reposts of third-party posts do not include metrics for your page because of a LinkedIn API limitation."
What the platform APIs stopped giving you
Some of the most important gaps in social media analytics are not the vendors' fault. The platforms are removing metrics, and the removals accelerated in 2025.
Meta's v22.0 changelog deprecated the impressions field on media and user insights "for all versions on April 21, 2025," replacing it with views. Then, on August 15, 2025, Meta's developer blog announced a broader change effective November 15, 2025: "we're deprecating the impressions metric. This metric will be replaced by the views metric on all API versions," and "we are deprecating the page fans metrics."
Hootsuite published a dedicated Facebook deprecation page that spells out the consequences more clearly than Meta's own changelog. It states: "With these changes, Facebook will no longer provide organic impressions data." The page lists roughly two dozen removed metrics, most annotated with the phrase "(no replacement metric)." That repeated annotation is worth reading in full, because it means the data is not just renamed, it is gone.
On X, the restrictions are policy-driven as well as technical. Non-public, organic, and promoted metrics are only available for posts created within the last 30 days. And X's developer policy states: "You may not use the X API to measure the availability, performance, functionality, or usage of X for benchmarking, competitive, or commercial purposes." This is why no tool in this set offers X competitor reach or benchmarking, and why any vendor claiming X competitive intelligence should be asked exactly what data source they are using.
On Instagram, Meta enforces thresholds: "follower_count and online_followers metrics are not available on Instagram business or creator accounts with fewer than 100 followers," and "Demographic metrics only return the top 45 performers." These are not bugs in the tool; they are limits in the API.
Buffer documents the downstream effect plainly: "Due to Meta limitations, we can't ingest post clicks, impressions, engaged users, or gender/age demographics for Facebook Pages." Naming what you cannot retrieve is rarer in this category than it should be.
The practical consequence for a B2B buyer is that year-over-year reporting on Facebook is now broken for any metric that relied on organic impressions. If your 2025 Q1 report showed impressions and your 2026 Q1 report shows views, the numbers are not comparable, and no vendor can fix that.
Dark social and assisted conversions, the two gaps nobody closes
These two metrics sit at the top of most B2B buyers' wish lists and at the bottom of every vendor's product.
Hootsuite's glossary defines dark social clearly: "Dark social is social sharing that cannot be traced back to the original source. This means the content has been passed on through private channels like email or messaging apps, rather than public channels like timelines and newsfeeds. Dark social shows up in analytics programs as 'direct traffic.'"
Several of these vendors define dark social in a glossary or a blog post. None of the seven documents a metric for it. There is no "dark social shares" column in any dashboard, no trend line, no alert. The sharing happens outside the platforms' tracking infrastructure, and it surfaces in web analytics as direct traffic with no referrer, indistinguishable from someone typing your URL into a browser.
What buyers do instead is append UTM parameters to every link shared on social, so that when someone copies and pastes that link into Slack or email, the UTM survives and the click is at least attributed to the original social post. This is a workaround, not a measurement, and it only works when the recipient does not strip the parameters.
Assisted conversions face a similar structural problem. The metric was defined in Universal Analytics as "the number (and monetary value) of sales and conversions the channel assisted", and GA4 now covers the same ground through conversion paths. Either way it is a web analytics metric that needs multi-touch attribution, and no social media management tool in this set documents reporting it.
The division of labor is the reason. The social tool sees the click, the web analytics tool sees the session, the CRM sees the deal. No single product connects all three, and the social analytics layer has the least visibility into what happens after the click.
Conversions, ROI and attribution: what social analytics can and cannot tell you
B2B buyers evaluating social media analytics almost always ask about ROI. The honest answer is that social analytics tools measure the top of the attribution chain, not the bottom.
In most tools, attribution starts and ends with UTM-tagged links. Hootsuite states: "Without a unique UTM added to each link you post, you won't be able to measure content performance at the individual post level," and without them "all your website activity is combined with your earned data under 'Non-UTM Traffic' for each social network as a whole."
Sprout Social's Google Analytics report is built on sessions: "The Google Analytics metric driving this report in Sprout Social is 'sessions' which measures the number of clicks to your website," and "This report only collects data and sessions where the utm_medium includes the keyword 'social.'" If your tagging is inconsistent, so is the report.
One tool goes further than the rest. Agorapulse documents ROI dashboards that are "pre-filtered on organic social exclusively" and reports revenue against individual posts and profiles. The number comes from Google Analytics by way of your UTMs, so it is web conversion value, and it is only as good as your tagging. It is not pipeline, and it is not closed-won.
The CRM integrations, meanwhile, are workflow integrations rather than attribution. Sprout Social's Salesforce integration lets you "Send qualified leads to your sales team, create new contacts, and create new cases for your customer service teams directly from social." Records go out. Revenue does not come back.
The only documented attribution mechanism among the seven tools is Sprout Social's Employee Advocacy link attribution, and it comes with its own caveat: "Sprout is unable to assist with writing or deploying code to your CRM." This means the last mile of connecting a social share to a closed deal still falls on your own engineering or operations team.
Where B2B revenue attribution actually lives is in marketing automation. HubSpot, for contrast, documents "Deal Revenue Attribution: measures which sources, assets, and interactions had the greatest impact on deal revenue," on its Enterprise tier. That is a different product category. Hootsuite documents connecting Google Analytics or Adobe Analytics for deeper measurement, but the detailed metric definitions for its advanced analytics features are not published openly.
The takeaway is not that social analytics is useless for ROI. It is that the social tool measures reach, engagement, and clicks. The web analytics tool measures sessions and conversions. The CRM measures pipeline and revenue. Attribution requires all three, and no social analytics tool in this set closes the loop alone.
Velocity: Best for seeing whether your brand is getting attention on the topics you care about
Best for
- Teams that need to know whether the brand is noticed on the topics that matter, next to competitors
- Teams that want cross-channel reporting and publishing in the same workflow
- Teams that already have a measurement stack and want the topic-level view it does not give them
What it does
Velocity documents Attention in one sentence: it "tracks how much attention your brand gets on the topics relevant to it, compares that attention with competitors, and highlights important topics where there is room to grow." That is a topic-level view rather than an attempt to measure every social metric. Attention is adjacent to share of voice without being the same thing: share of voice, as the other vendors define it, is a proportion of matched messages inside a listening topic, while Attention is organized around topics and competitive visibility.
Velocity also documents "cross-channel reporting tools for a shared view" and "basic analytics in one workflow". The AI agent applies your brand profile to the content it drafts, and publishing and analytics sit in the same product. The analytics layer is lighter than what Sprout Social or Hootsuite document.
Choose Velocity when the question is topic-level visibility against competitors. If you need to know how a metric is calculated or how far the history goes, Sprout Social and Hootsuite publish the most detailed documentation.
What you'll like
- Attention answers one question directly: whether you are visible on the topics that matter, and where there is room to grow
- Cross-channel reporting tools for a shared view
- Publishing and analytics in one workflow rather than two products
- An AI agent that applies your brand profile to what you publish
Why it might not be a good fit
- The measurement stack is not documented. Velocity's pages do not state how engagement rate is calculated, how far data is retained, or whether sentiment, share of voice, conversions or attribution are reported, so a buyer who needs those should plan on another tool alongside it.
- Per-metric competitor benchmarking is not documented. Attention compares topic-level visibility. The percentile and per-network competitor benchmarks that Sprout Social and Hootsuite publish are not described on Velocity's pages.
Sprout Social: Best for the deepest documented metric definitions, if you buy the add-ons
Best for
- Teams that need to cite exactly how every metric is calculated, from public documentation
- Organizations willing to buy Listening, Premium Analytics and the Advanced plan to complete the measurement stack
What it does
Sprout Social publishes the most detailed metric definitions of any tool in this set. Its help center documents the formula for engagement rate (per impression), the data sources for its Google Analytics report, the gating for share of voice and sentiment, and the retention windows for each network. For Instagram, Sprout Social documents "Up to 90 days back for most metrics." For LinkedIn, the last 90 days of posts. For TikTok, 60 days. For Facebook, the last 500 posts.
Sprout Social's benchmark feature compares your Instagram engagement rate against "the 25th, 50th, and 75th percentile performers on the network", with all data anonymized. This is Premium Analytics only. Sprout Social's Google Analytics integration measures sessions where the utm_medium includes "social," and its Salesforce integration pushes leads and cases into the CRM.
Choose Sprout Social when you need the deepest published documentation of what every number means and you are prepared to buy the add-ons that unlock the rest.
What you'll like
- The engagement rate formula is published and citable, which removes ambiguity from a board report
- Retention windows are documented network by network
- Share of voice has a published definition, inside the Listening add-on
- Response time is documented as Average First Reply Time
Why it might not be a good fit
- Share of voice, sentiment and benchmarks are all gated. Share of voice needs the Listening add-on, sentiment sits in three separate places, and benchmarking is Premium Analytics. None of them is on the base plan.
- LinkedIn competitor analysis is not available. "At this time, LinkedIn API does not support competitor analysis, which means a LinkedIn page/profile cannot be connected to see Competitor Performance." That is a platform limit rather than a product gap.
Hootsuite: Best for documenting what the networks have taken away
Best for
- Teams that need to explain to stakeholders which metrics the platforms removed and what replaced them
- Organizations connecting Google Analytics or Adobe Analytics for web measurement
What it does
Hootsuite publishes the most transparent documentation of platform API removals among the seven tools compared here. Its dedicated Facebook deprecation page lists roughly two dozen removed metrics, most annotated "(no replacement metric)," and states plainly: "With these changes, Facebook will no longer provide organic impressions data." For a buyer trying to understand why year-over-year numbers broke, Hootsuite's documentation is the clearest starting point.
Hootsuite's engagement rate in Analytics divides by the number of people who saw the post. Its Lumen listening module uses different denominators again, dividing by followers on LinkedIn and by reach on Instagram. Hootsuite documents connecting Google Analytics or Adobe Analytics for deeper measurement, though the detailed metric definitions for its advanced analytics features sit behind a login.
Its benchmark feature collects data "from a minimum of 100 accounts to calculate an industry average" and labels competitor engagement as "Estimated engagement." Competitor comparison is tiered: Enterprise and Advanced compare 20 accounts, Standard and Business five, Professional and Team two.
Hootsuite can backfill "from 28 days to up to 12 months of historical data" depending on the network and account type, cannot store YouTube data older than two years, and notes that "Due to limitations from X, we cannot collect data for posts marked as 'potentially sensitive.'"
Choose Hootsuite when you need to explain to stakeholders what the platforms stopped providing and why the numbers changed.
What you'll like
- The Facebook deprecation page is the most useful document in the category for understanding what broke in 2025
- Sentiment coverage is quantified, at 186 languages and up to 90% accuracy in Lumen
- Competitor comparison limits are published per plan tier
- Backfill and retention windows are documented per network
Why it might not be a good fit
- Share of voice is in neither Analytics nor Lumen. It is documented only in Insights, which is powered by Brandwatch, so a buyer expecting it in the analytics product will not find it there.
- The advanced analytics documentation is behind a login. The detailed metric definitions for Hootsuite's advanced analytics are not published openly, so a buyer cannot verify them before purchasing.
Agorapulse: Best for share of voice and response time in the same product
Best for
- Teams that want share of voice and a response-time metric from one vendor
- B2B programs where reply speed is a reported KPI
What it does
Agorapulse and Sprout Social are the two tools here that document both share of voice and a response-time metric, and Agorapulse keeps them closer together. Share of voice sits inside Listening and shipped on July 2, 2026. Response time is documented as a metric, though it excludes LinkedIn, YouTube, and TikTok direct messages, and it does not count replies sent natively on the social platforms. Any tool's response-time number only counts replies sent through that tool, and Agorapulse is transparent about this limitation.
Agorapulse is also the one tool here that documents revenue against organic social, in ROI dashboards "pre-filtered on organic social exclusively". The figure comes from Google Analytics through your UTMs, so it is web conversion value rather than CRM pipeline, and it is only as reliable as your tagging. Its CRM integration follows the category pattern: records go out, revenue does not come back.
Choose Agorapulse when share of voice and response time both need to reach the same report, and confirm which plan each one sits on before you sign.
What you'll like
- Share of voice inside Listening, added on July 2, 2026
- A response-time metric with its exclusions stated rather than hidden
- ROI dashboards filtered to organic social, the only revenue reporting of its kind in this set
Why it might not be a good fit
- Response time excludes several networks. LinkedIn, YouTube and TikTok direct messages are not covered, and replies sent natively on any platform are not counted.
- Benchmark detail is thinner than Sprout Social's or Hootsuite's. Agorapulse does not document the tiered competitor comparison or the percentile benchmarking those two publish.
Metricool: Best for per-network metric detail with the API limits spelled out
Best for
- Teams that want to see which metrics exist on each network with the API limits named
- Buyers who need to understand why a competitor's engagement rate is not comparable to their own
What it does
Metricool publishes per-network metric pages that name the API limitations alongside the data. Its competitor engagement rate is calculated as "Average interactions / Number of followers x 100," and Metricool warns explicitly that it is not directly comparable to your own account's engagement because reach cannot be retrieved through the API for accounts you do not own. This is the kind of disclosure most vendors skip.
Metricool displays the previous 30 days of data when you connect a social media account for the first time. Its LinkedIn coverage excludes reposts: "Metricool can only show analytics for original content published by your page. Reposts of third-party posts do not include metrics for your page because of a LinkedIn API limitation." Metricool's competitor analysis does not cover LinkedIn.
Choose Metricool when you want per-network metric transparency and are comfortable with a 30-day initial data window.
What you'll like
- API limitations are named per network rather than buried in a footnote
- The competitor engagement formula is published, with a warning about comparability
- Per-network metric pages make it easy to check coverage before buying
Why it might not be a good fit
- No share of voice, sentiment or response time is documented. A buyer who needs any of the three will be running a second tool alongside it.
- LinkedIn coverage has documented gaps. Reposts carry no metrics because of a LinkedIn API limitation, competitor analysis does not cover LinkedIn, and a first connection shows the previous 30 days.
Buffer: Best for honest reporting about where its own numbers disagree
Best for
- Teams that value documented honesty about measurement limits over feature breadth
- Small and mid-size B2B programs that need straightforward analytics
What it does
Buffer publishes an article titled "Why does my engagement rate look different in Analyze than in Insights?" that explains why its own two reports disagree: "Analyze averages each post's rate over your date range, while Insights adds up all interactions," and "Instagram uses views in Analyze and reach in Insights." This level of self-disclosure is unusual in the category and useful for a buyer trying to understand why numbers shift between reports.
Buffer's LinkedIn engagement rate formula is "(reactions + comments) / impressions." Its backfill varies by network, and for X, Mastodon, and Bluesky it is the connection date only. Buffer also states: "Due to Meta limitations, we can't ingest post clicks, impressions, engaged users, or gender/age demographics for Facebook Pages."
Choose Buffer when you want a tool that tells you where its own numbers break, and your measurement needs do not extend to share of voice, sentiment, or response time.
What you'll like
- A published article explaining where its own two reports disagree
- A documented LinkedIn engagement rate formula
- Meta's limits stated up front rather than discovered after purchase
Why it might not be a good fit
- Facebook Page data is heavily limited. "Due to Meta limitations, we can't ingest post clicks, impressions, engaged users, or gender/age demographics for Facebook Pages."
- No share of voice, sentiment, response time or competitor benchmarking is documented. The analytics are clear and well explained, but narrow.
Later: Best for Instagram-first reporting, with a LinkedIn gap worth knowing
Best for
- B2B teams whose primary channel is Instagram
- Programs where LinkedIn company page reporting is not a requirement
What it does
Later's engagement rate for Instagram posts and Reels is calculated as "(Likes + Comments + Saves + Shares) / Reach," a formula that is documented and consistent with Instagram's native metrics. Later's analytics strength is on Instagram, and its data retention scales with plan tier: Starter offers up to 3 months, Growth up to 1 year, and Scale up to 2 years.
Later's LinkedIn coverage is significantly limited. Its documentation states: "LinkedIn Analytics is available for personal LinkedIn profiles only," "Post Performance analytics are only available for posts published through Later," and "we collect post-performance data for a period of two weeks." For a B2B buyer whose primary network is a LinkedIn company page, this is a disqualifying gap.
Choose Later when Instagram is your primary B2B channel and you do not need LinkedIn company page analytics.
What you'll like
- A documented Instagram engagement rate formula
- Retention tiers that are published and scale with the plan
- Instagram reporting that is detailed and well organized
Why it might not be a good fit
- LinkedIn is personal profiles only. "LinkedIn Analytics is available for personal LinkedIn profiles only", post performance covers only posts published through Later, and the data is collected "for a period of two weeks". For a B2B buyer reporting on a company page, that is disqualifying.
- No share of voice, sentiment, response time or competitor benchmarking is documented. Later's depth is on Instagram, and the rest of the measurement stack is not covered.
How to choose a social media analytics tool for B2B in 2026
The deepest published metric definitions point to Sprout Social. Knowing exactly which metrics the networks have removed points to Hootsuite. Share of voice and response time in the same product point to Agorapulse. Per-network detail with the API limits spelled out points to Metricool. Honest documentation of where a vendor's own numbers disagree points to Buffer. Instagram-first reporting points to Later, as long as LinkedIn company pages are not your main network.
Velocity is our pick when the question is whether your brand is getting noticed on the topics you care about, next to your competitors. Attention answers that question directly, and the combination of publishing, analytics, and an AI agent in one workflow reduces steps for teams that want to act on what they learn. The measurement stack beyond Attention is not documented, so a buyer who needs detailed metric definitions, sentiment, share of voice, or attribution should plan on pairing Velocity with another tool.
The hardest gaps on this page belong to the platforms, not the vendors. Facebook stopped providing organic impressions in November 2025. X does not release audience demographics to anyone. LinkedIn caps everything at twelve months and offers no competitor endpoint. What actually differs between tools is how they calculate the metrics they do have and how much they tell you about their own limits. The vendors that document their formulas, name their denominators, and publish their gaps are the ones a B2B buyer can trust in a quarterly review.
How to run a thirty minute check on any analytics tool before you buy
- Ask for the engagement rate formula in writing, and check the denominator. It is impressions in Sprout Social, people reached in Hootsuite, reach in Later.
- Ask how far back the data goes for your main network, then check it against the network's own ceiling. LinkedIn caps at twelve months no matter who you ask.
- Ask whether share of voice and sentiment are in the plan you are quoted or in a separate listening product. In Sprout Social and Agorapulse they are the latter.
- Ask what happens to your LinkedIn company page reporting specifically, including competitor data, and get the answer in writing. Later documents personal profiles only.
- Ask how a closed deal would ever appear in the tool. The honest answer is that it will not, and a vendor who says otherwise is describing your CRM.
This is a practical way to compare tools on documentation rather than demos, not a claim of hands-on test results.
Frequently Asked Questions
I am a B2B buyer evaluating social media analytics; which metrics matter most and which are often omitted?
The ones that matter are impressions or views, reach, engagement rate, clicks, follower and visitor demographics, and web sessions, because they connect social activity to audience quality and site traffic. The ones usually omitted are share of voice and sentiment, which are a Listening add-on in Sprout Social, an Insights product in Hootsuite, and part of Listening in Agorapulse, and which Buffer, Later and Metricool do not document at all. Dark social, assisted conversions and pipeline revenue are missing from all seven tools. Velocity documents Attention, which answers topic-level visibility against competitors, and does not document sentiment, share of voice, conversions or attribution.
Why is engagement rate different in every social media analytics tool?
Because the denominator differs. Sprout Social divides by impressions, Hootsuite by the number of people who saw the post, Later by reach, Buffer by impressions on LinkedIn profiles, and Hootsuite's own Lumen module by followers on LinkedIn and by reach on Instagram. Buffer publishes an article explaining why its two reports disagree with each other: "Analyze averages each post's rate over your date range, while Insights adds up all interactions." Metricool warns separately that its competitor engagement rate is not comparable to your own, because reach cannot be retrieved for accounts you do not own.
Which social media metrics did the platforms remove in 2025 and 2026?
Instagram removed impressions on April 21, 2025, replaced by views. Meta deprecated impressions for Facebook Pages on November 15, 2025, again replaced by views, and deprecated the page fans metrics at the same time. Hootsuite's Facebook deprecation page states the consequence plainly: "With these changes, Facebook will no longer provide organic impressions data." It lists roughly two dozen removed metrics, most annotated "(no replacement metric)". Any year-over-year Facebook comparison spanning those dates is broken at the API level, and no vendor can repair it.
Can social media analytics tools report pipeline or revenue for B2B?
Not from your CRM. Agorapulse is the exception worth knowing about, because it documents ROI dashboards "pre-filtered on organic social exclusively", but that revenue comes from Google Analytics through your UTMs, so it is web conversion value rather than pipeline. The CRM integrations in Sprout Social, Hootsuite and Agorapulse push records into the CRM rather than reading revenue back. Sprout Social's Salesforce integration is described as letting you "Send qualified leads to your sales team, create new contacts, and create new cases for your customer service teams directly from social." The only documented attribution mechanism among the seven is Sprout Social's Employee Advocacy link attribution, and Sprout Social adds that "Sprout is unable to assist with writing or deploying code to your CRM." Deal revenue attribution lives in marketing automation, where HubSpot documents it on its Enterprise tier.
Does Sprout Social include share of voice and sentiment?
Sprout Social includes neither on the base plan. Share of voice is defined as the share of matching messages within a Listening topic, and Sprout Social's Listening documentation states that "This feature is only available for Social Listening customers." Sentiment sits in three separate places: Sentiment for Messages on the Advanced plan, post-comment sentiment in Premium Analytics, and sentiment in the Listening add-on. Hootsuite splits its own the same way, with share of voice only in Insights and sentiment in Lumen.
What LinkedIn analytics can a third party tool actually retrieve?
More than most buyers expect. Follower and visitor demographics by location, seniority, job function, industry and company size are available through LinkedIn's Community Management API, so a tool refusing to show them is making a product choice. What is genuinely unavailable is demographics as a time series, because several facets are unsupported once a time interval is requested. There is also no competitor endpoint, which Sprout Social confirms, and LinkedIn discontinued employee advocacy from November 2024. Everything is capped at twelve months. Later documents LinkedIn support for personal profiles only, and Metricool's competitor analysis does not cover LinkedIn.
What is dark social and can any tool measure it?
Dark social is, in Hootsuite's own words, "social sharing that cannot be traced back to the original source", passed through private channels like email or messaging apps, and it "shows up in analytics programs as 'direct traffic.'" Every vendor in this set defines it somewhere in a glossary. None of the seven documents a metric for it. The workaround buyers use is a unique UTM parameter on every link, so that a copied and pasted link still carries its origin, but that is a tagging discipline rather than a measurement, and it fails whenever the parameters are stripped.
How far back does social media analytics data go?
It varies by vendor and by network. Sprout Social documents up to 90 days for Instagram, the last 90 days of posts for LinkedIn, 60 days for TikTok and the last 500 posts for Facebook. Hootsuite backfills "from 28 days to up to 12 months of historical data" depending on the network, and cannot store YouTube data older than two years. Metricool shows the previous 30 days on a first connection. Later ranges from 3 months on Starter to 2 years on Scale. Buffer's backfill varies, and for X, Mastodon and Bluesky it is the connection date only. LinkedIn caps everything at twelve months whoever you ask, so switching vendors resets your LinkedIn history.
Related reading
- 10 Best Scheduling Tools for Adapting One Post to Every Platform (2026)
- 7 Best Tools to Publish Carousel Posts to Instagram, LinkedIn and X (2026)
- 8 Best Tools to Schedule and Publish Video to Social Media (2026)
- AI social media management tool guide 2026: 12 best AI social media management tools reviewed