7 Best AI Agents and Tools for On-Brand Social Media Infographics (2026)
 Pavan Ravikumar·Marketing Engineer, Velocity

When a small business, growing brand, or agency publishes a useful blog post, report, or data update, creating the social version still requires a separate round of work. Someone still has to choose the story, verify the data, turn it into an on-brand infographic, adapt the data visualization for social media, and preserve the brand voice. For example, a spreadsheet may reveal a useful customer trend, but it still needs a clear data visualization aligned with the brand kit before it is ready for social media.
AI agents and visual tools can help at different points in that work. An AI infographic generator may turn a blog URL, pasted text, or figures into a first visual. A brand kit or saved Brand Identity can guide colors, fonts, logos, and visual direction. The team can then refine the headline, data visualization, caption, and format before scheduling a chosen version. This turns a blog URL or data source into an on-brand social media infographic the team can still refine, approve, and schedule.
Product capabilities vary across the infographic workflow. Some products focus on editable infographic design, templates, or diagrams. Others emphasize brand assets or a content calendar. This guide compares the capabilities each product offers: template flexibility, brand kit controls, infographic and data-visualization features, available social media publishing options, pricing, and source types such as a blog URL.
| Platform | Best for | Key features | Pricing and Free plan |
|---|---|---|---|
| Velocity | Businesses turning blog posts or data into on-brand social media infographics | AI agents turn blog posts and data into on-brand social media infographics using Brand Identity | Free plan available; Business Pro from $39/month. |
| Canva | Design teams editing reusable visual assets | Templates, charts, and visual editor | Free plan available; Pro $144/year. |
| Piktochart | Teams shaping source material into editable layouts | Text inputs, chart elements, and visual editor | Free plan available; Pro $15/month. |
| Visme | Teams preparing internal visual materials | Presentation layouts, chart tools, and visual editor | Free plan available; Starter $12.25/person/month, billed annually. |
| Venngage | Teams creating editable layouts from supplied information | Prebuilt layouts, chart tools, and visual editor | Free plan available; Premium $19/month. |
| Adobe Express | Teams working in Adobe's design workspace | Templates, image editing, and visual editor | Free plan available; Premium $9.99/month. |
| Napkin AI | Teams making explanatory visuals from text | Text-to-visual generation, editor, and custom styles | Free plan available; Plus $9/person/month. |
What an AI social media agent for on-brand social media infographics is, and what it is notLink to this section
An AI social media agent for on-brand social media infographics connects the work of turning a selected blog post or data source into a social-ready visual. It can use a Brand Identity and account context to choose an angle, prepare an editable infographic, caption, and channel version, then support review before moving the approved work toward scheduling, publishing, and later performance learning where supported.
Not every product with an AI feature takes on that role. A product may generate a diagram, create a data visualization, draft copy, or schedule a finished post. Each can be useful for one part of the job, while its documented workflow may end after that stage rather than carrying the selected work into the next one.
What an AI social media agent is not:
- A social listening or analytics platform: It can reveal audience or post signals, but its workflow normally ends with insight rather than an approved infographic.
- A visual-creation or design platform: It can turn supplied information into templates, charts, and editable layouts, but its workflow normally ends with the asset ready for a separate release process.
- An AI writing or caption generator: It can produce a hook, summary, or post copy, but its workflow may end after it returns draft text.
- A scheduler or publishing queue: It can organize finished posts by date and account, but it normally begins after the source, visual, and caption are already settled.
This guide compares source and brand context, visual preparation, review, Scheduling, Publishing, analytics, and pricing scope. That makes clear whether a buyer needs an AI agent for connected work or a focused tool for one specific stage.
The 7 best AI agents and tools for on-brand social media infographicsLink to this section
1. VelocityLink to this section
Best forLink to this section
- Small businesses looking for AI agents to turn blog posts into on-brand social media infographics.
- Growing brands needing data visualization that retains brand voice through a saved brand kit across recurring social posts.
- Agencies preparing source-data infographics for client review, social media scheduling, and publishing across separate client workspaces.
What it doesLink to this section
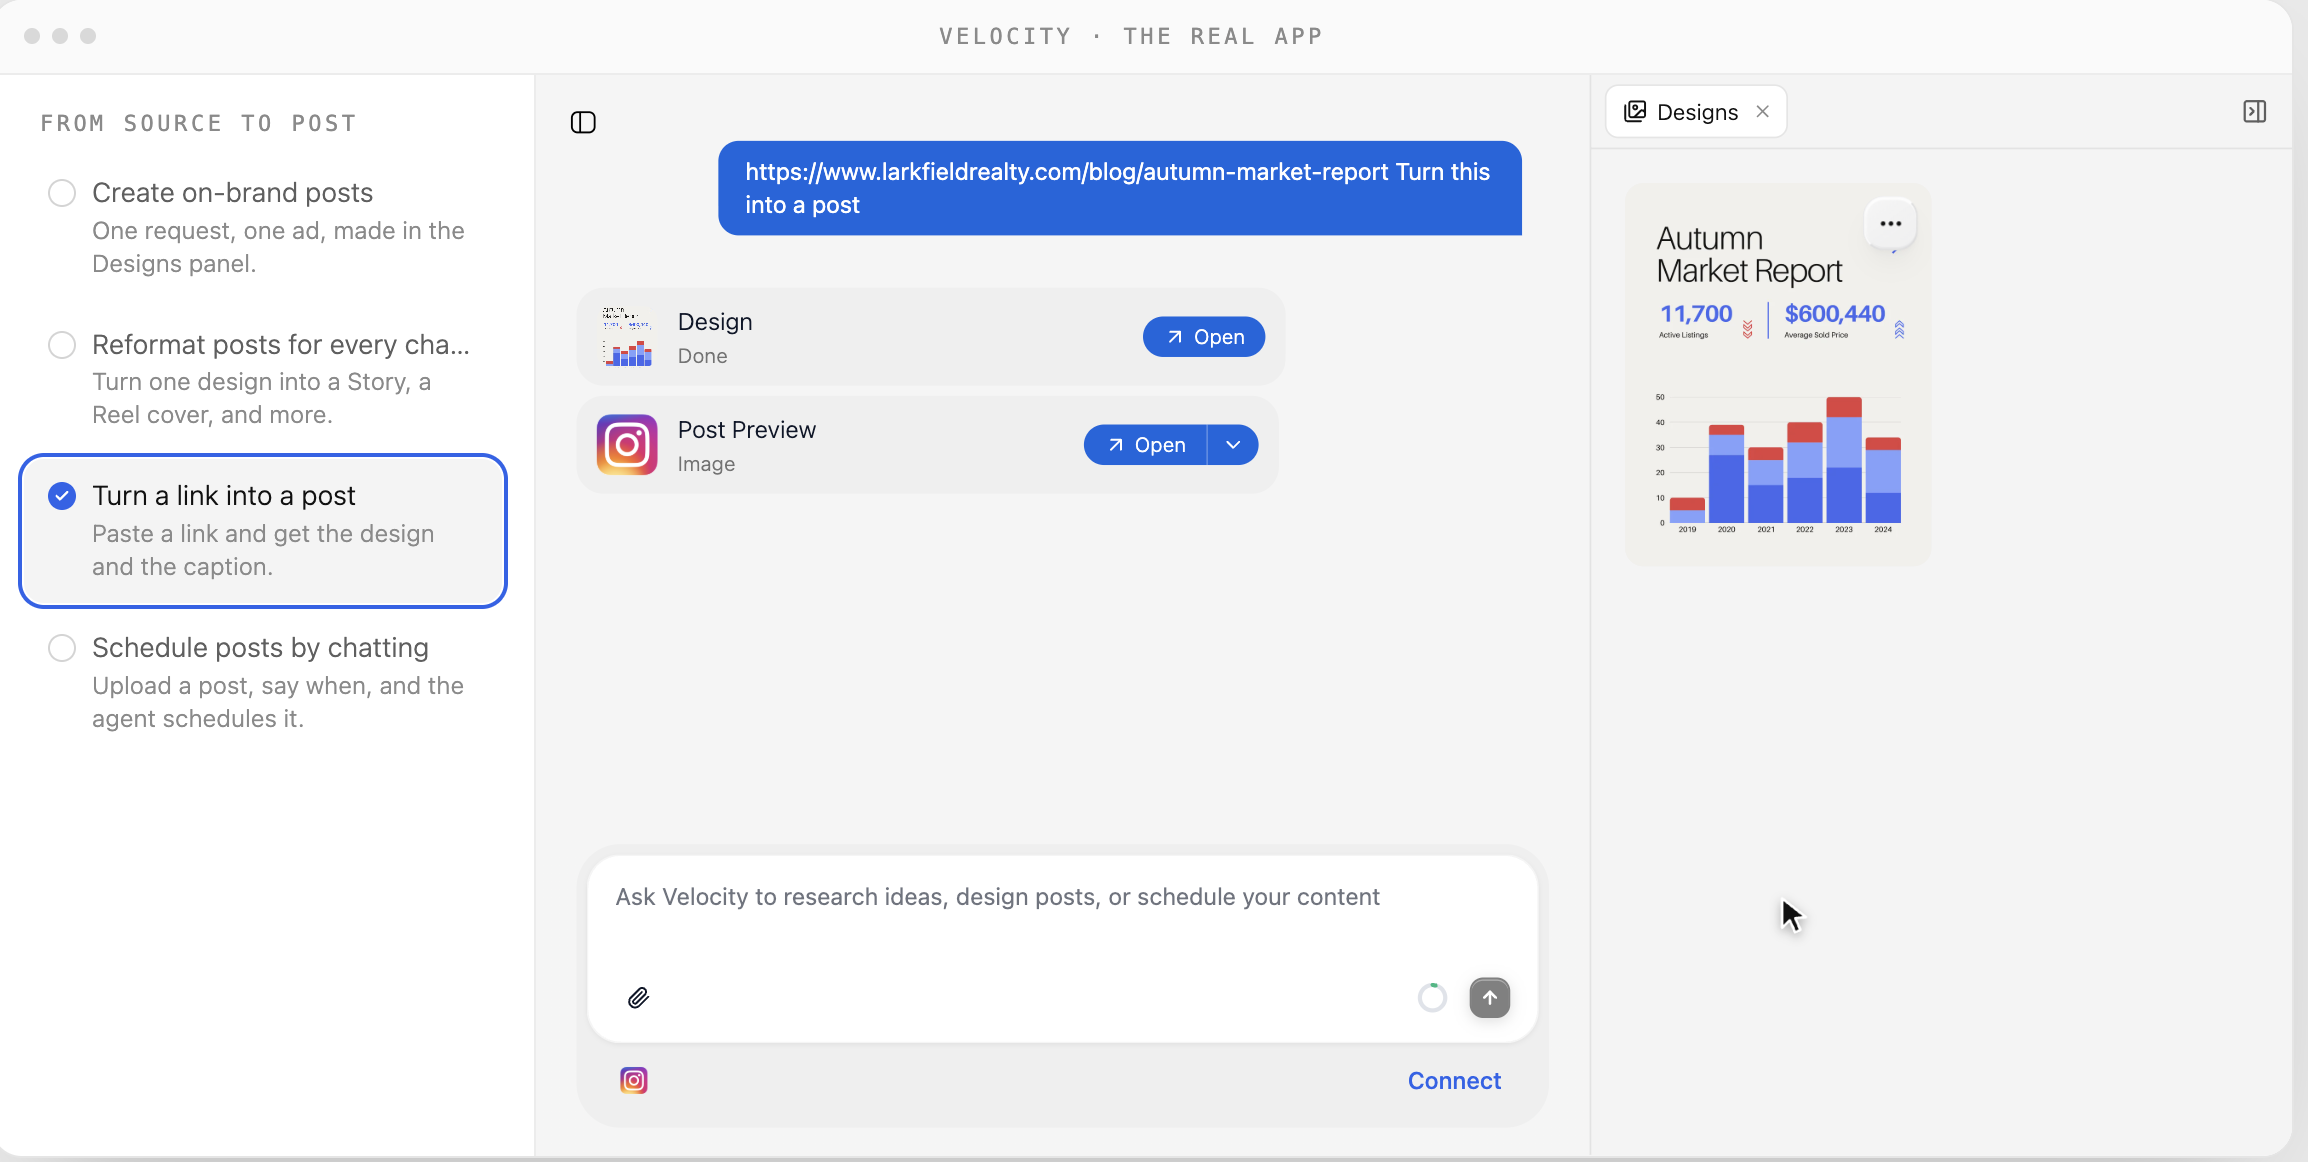
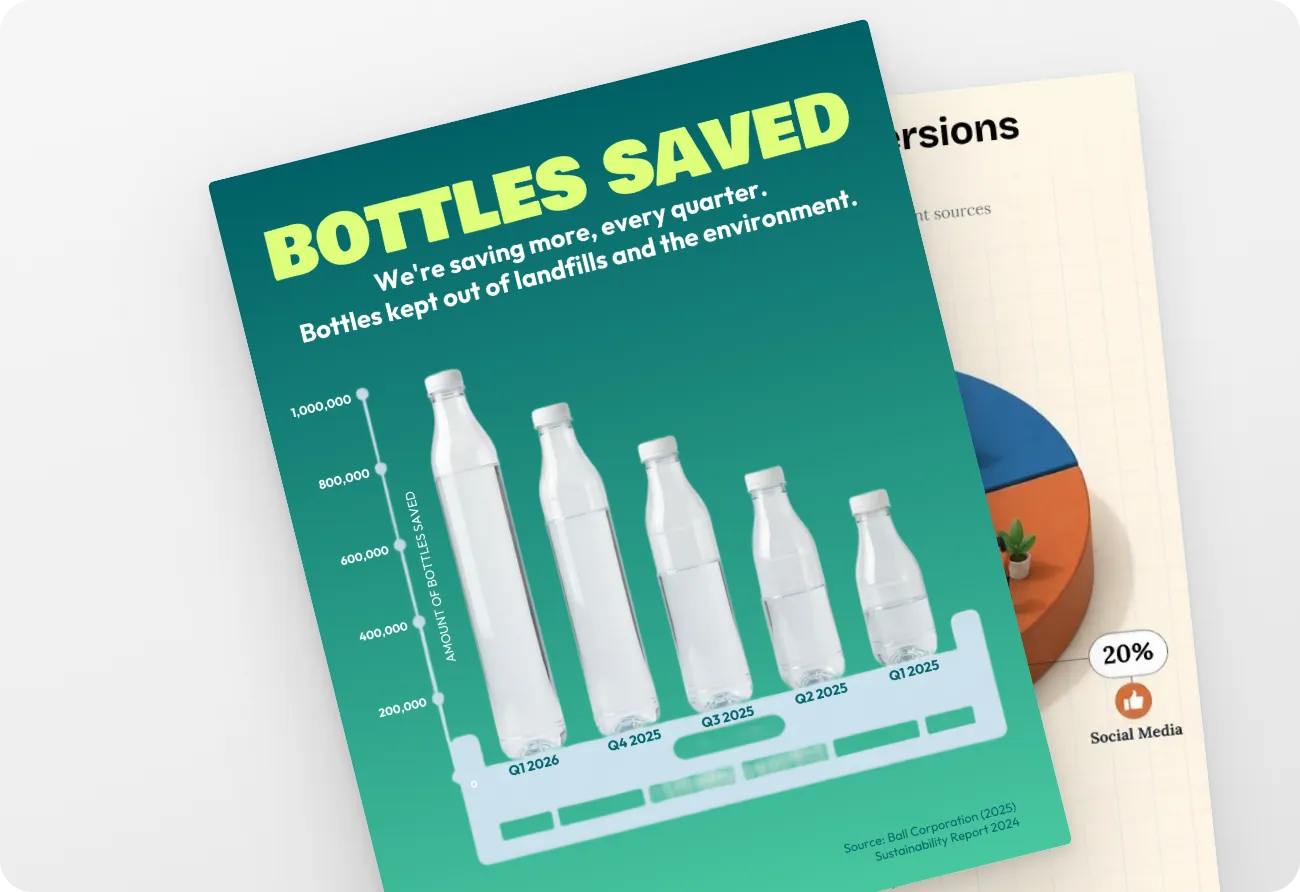
Velocity is an AI social media agent platform that turns a business goal and its context into reviewable social work. Its AI agents establish reusable brand context, then use it with a blog link, PDF report, CSV, or pasted data to create an editable on-brand infographic or carousel for social media. That gives teams one editable social asset to review, approve, and schedule without recreating the visual or caption each time a blog post or data update needs a social version.
Velocity's AI agents build a Brand Identity from a business website, past posts, brand guidelines, and visual assets. That saved context works as a brand kit, retaining the audience, approved language, brand voice, and visual direction for later requests. When a marketer shares a blog URL, PDF, CSV, or data source, the agents use that context to identify the points worth showing, then write exact figures into a design brief for the data visualization. They then create an editable on-brand infographic or matching carousel through AI on-brand designs, with the saved colors and fonts applied so the visual and caption remain consistent with the rest of the brand's social media content.
Once the AI agents turn a blog post or data source into an on-brand infographic and caption, Content Approval lets an owner or admin inspect the preview, approve it, or request changes in the same thread. The agents revise the draft and return it to that thread, retaining the source, caption, visual, and comment history. After approval, the agents add the selected social media infographic to the Content Calendar and use Scheduling to set its requested release date and time. If no time is specified, the agents select the best time to post using connected-account data.
At the scheduled time, Publishing sends the approved on-brand social media infographic or carousel, with its caption, to the selected connected account. Matching carousel slides publish together as one post, keeping the data visualization and caption aligned with the approved version. Analytics returns views and engagement from connected accounts. The AI agents can use those results to compare blog post angles, data stories, data visualization formats, social media channels, captions, and release times, giving teams evidence for the next infographic request rather than a generic performance report. Velocity is rated 4.8 out of 5 on G2 for AI social media management.
What you’ll likeLink to this section
- AI agents turn a blog URL, PDF, CSV, or figures into editable on-brand infographics.
- Saved Brand Identity gives agents a brand kit for colors, fonts, logo, and brand voice.
- For selected data, AI agents create an editable visual or carousel for social media.
- AI agents write captions explaining the data visualization's message for the selected audience.
- After feedback, agents revise the same draft while retaining comments, caption, and visual.
- Agents schedule and publish approved social media infographics, then use analytics to inform later requests.
Where it falls shortLink to this section
- A team that only needs an occasional editable template may not need a connected social workflow.
- A designer who needs vector paths or highly specialized illustration controls may prefer a dedicated design application.
Free plan: Yes (Free forever; no credit card required).
2. CanvaLink to this section
Best forLink to this section
- Campaign designers adapting reusable layouts for a launch series.
- Agencies handing editable visual files to clients for approval.
What it doesLink to this section
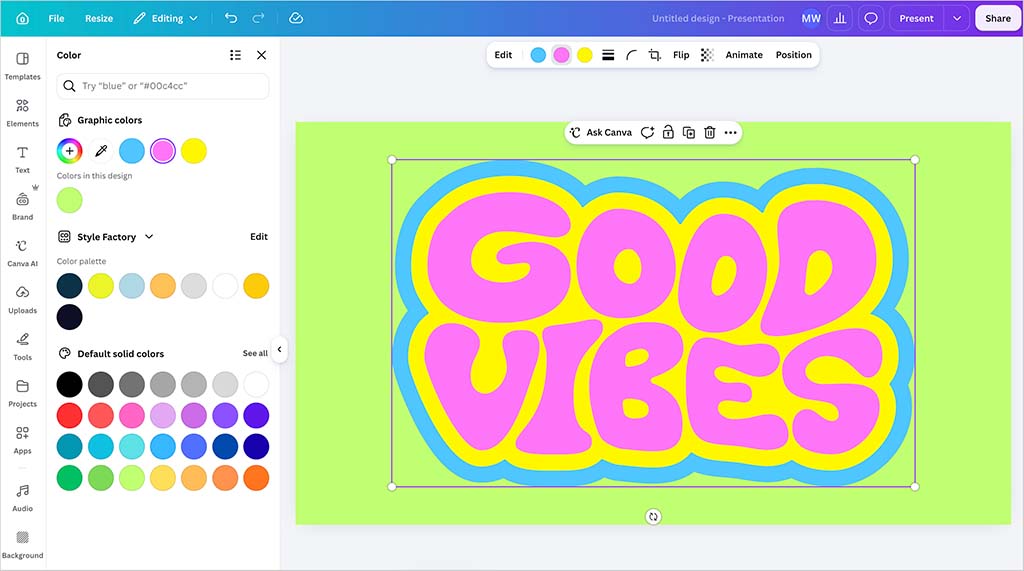
Canva centers on a visual editor with templates, charts, media, and saved color and type settings. A creator can choose a layout, edit text and imagery, then make a reusable campaign graphic in the canvas.
The documented workflow is design-led. Content Planner can place a finished design on a calendar for supported accounts, but the creator still selects the source, validates figures, decides the caption, and manages approval.
What you’ll likeLink to this section
- The canvas offers templates, media, and chart-building controls.
- Saved visual settings keep colors, fonts, and logos available.
- Its AI design feature creates editable starting points from a supplied idea.
Where it falls shortLink to this section
- The Free plan restricts saved color settings to three colors.
- A creator remains responsible for source selection and numerical accuracy.
- The calendar takes finished designs, so approval rules remain with the team's workflow.
Free plan: Yes.
Read the detailed comparison: Velocity vs. Canva.
3. PiktochartLink to this section
Best forLink to this section
- Internal-communications teams converting a report into a one-page visual.
- Agencies preparing a starter layout for client review.
What it doesLink to this section
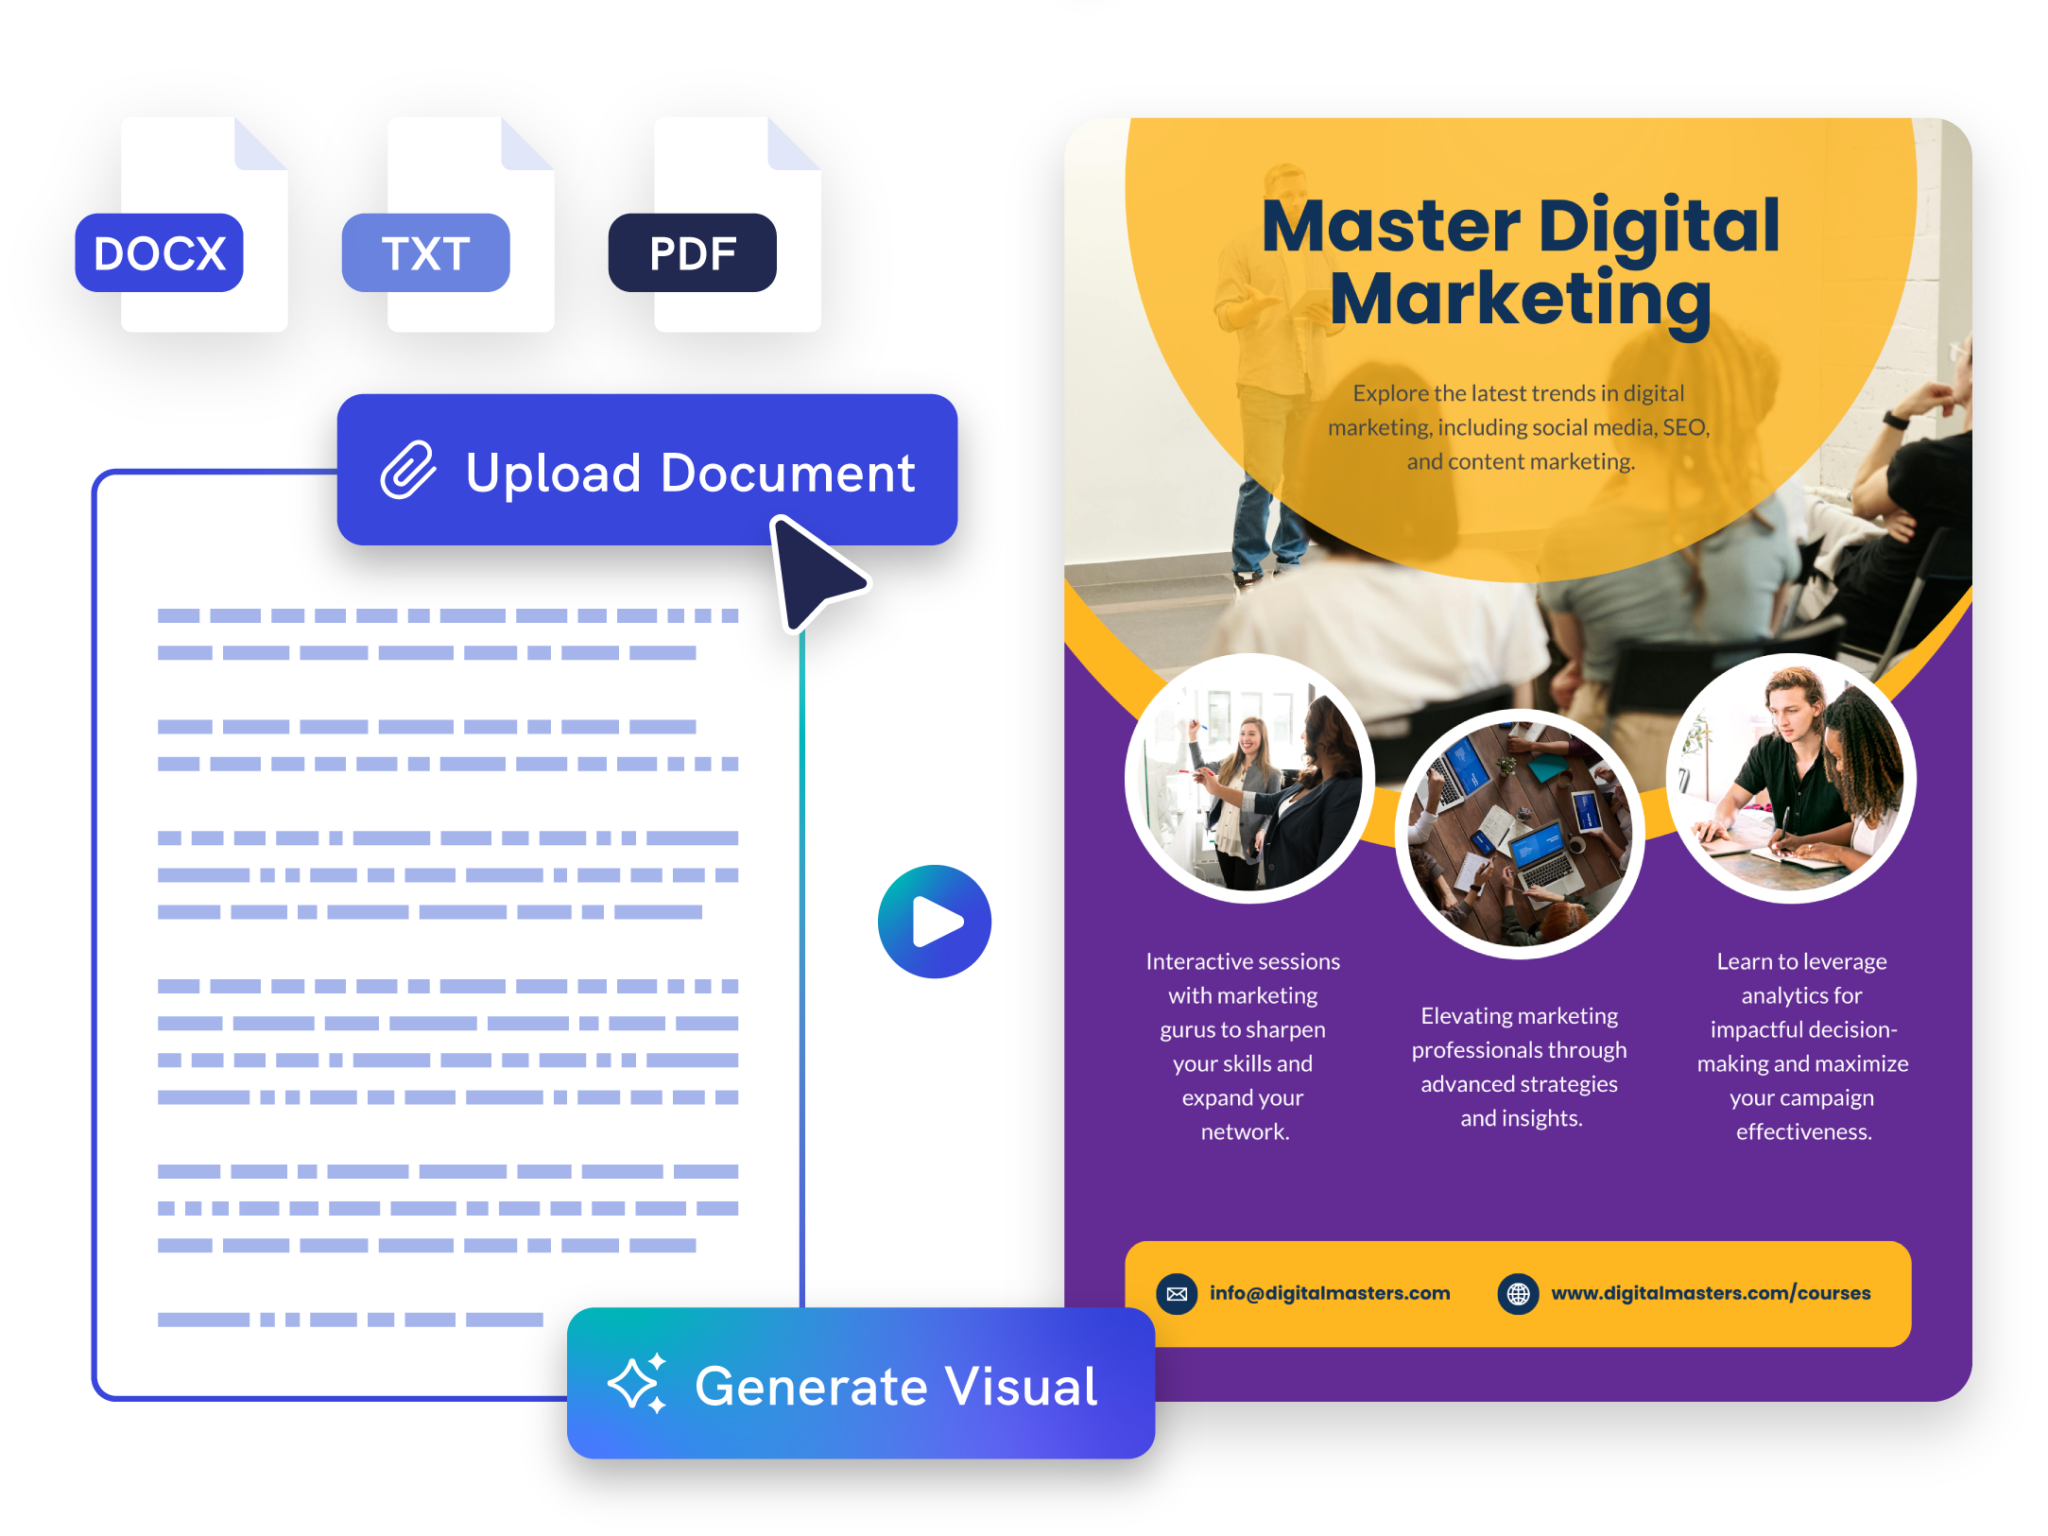
Piktochart accepts prompts, notes, reports, and uploaded documents, then creates an editable visual draft. Its editor lets a creator choose from generated designs before refining copy, colors, imagery, icons, and layout.
Its official page focuses on generation, editing, sharing, and download. A team still needs to validate source claims, make the approval decision, and move the finished visual through its own release process.
What you’ll likeLink to this section
- Prompts, notes, reports, and common document uploads start a draft.
- Several design options can be selected before refinement.
- Copy, colors, imagery, icons, and layout remain editable.
Where it falls shortLink to this section
- Free use has 60 AI credits a month.
- An uploaded source still needs human review for factual accuracy.
- The cited page ends at sharing or download rather than a connected release process.
Free plan: Yes.
4. VismeLink to this section
Best forLink to this section
- Internal-communications teams building presentation-style explainers.
- Agencies presenting chart-led layouts for client feedback.
What it doesLink to this section
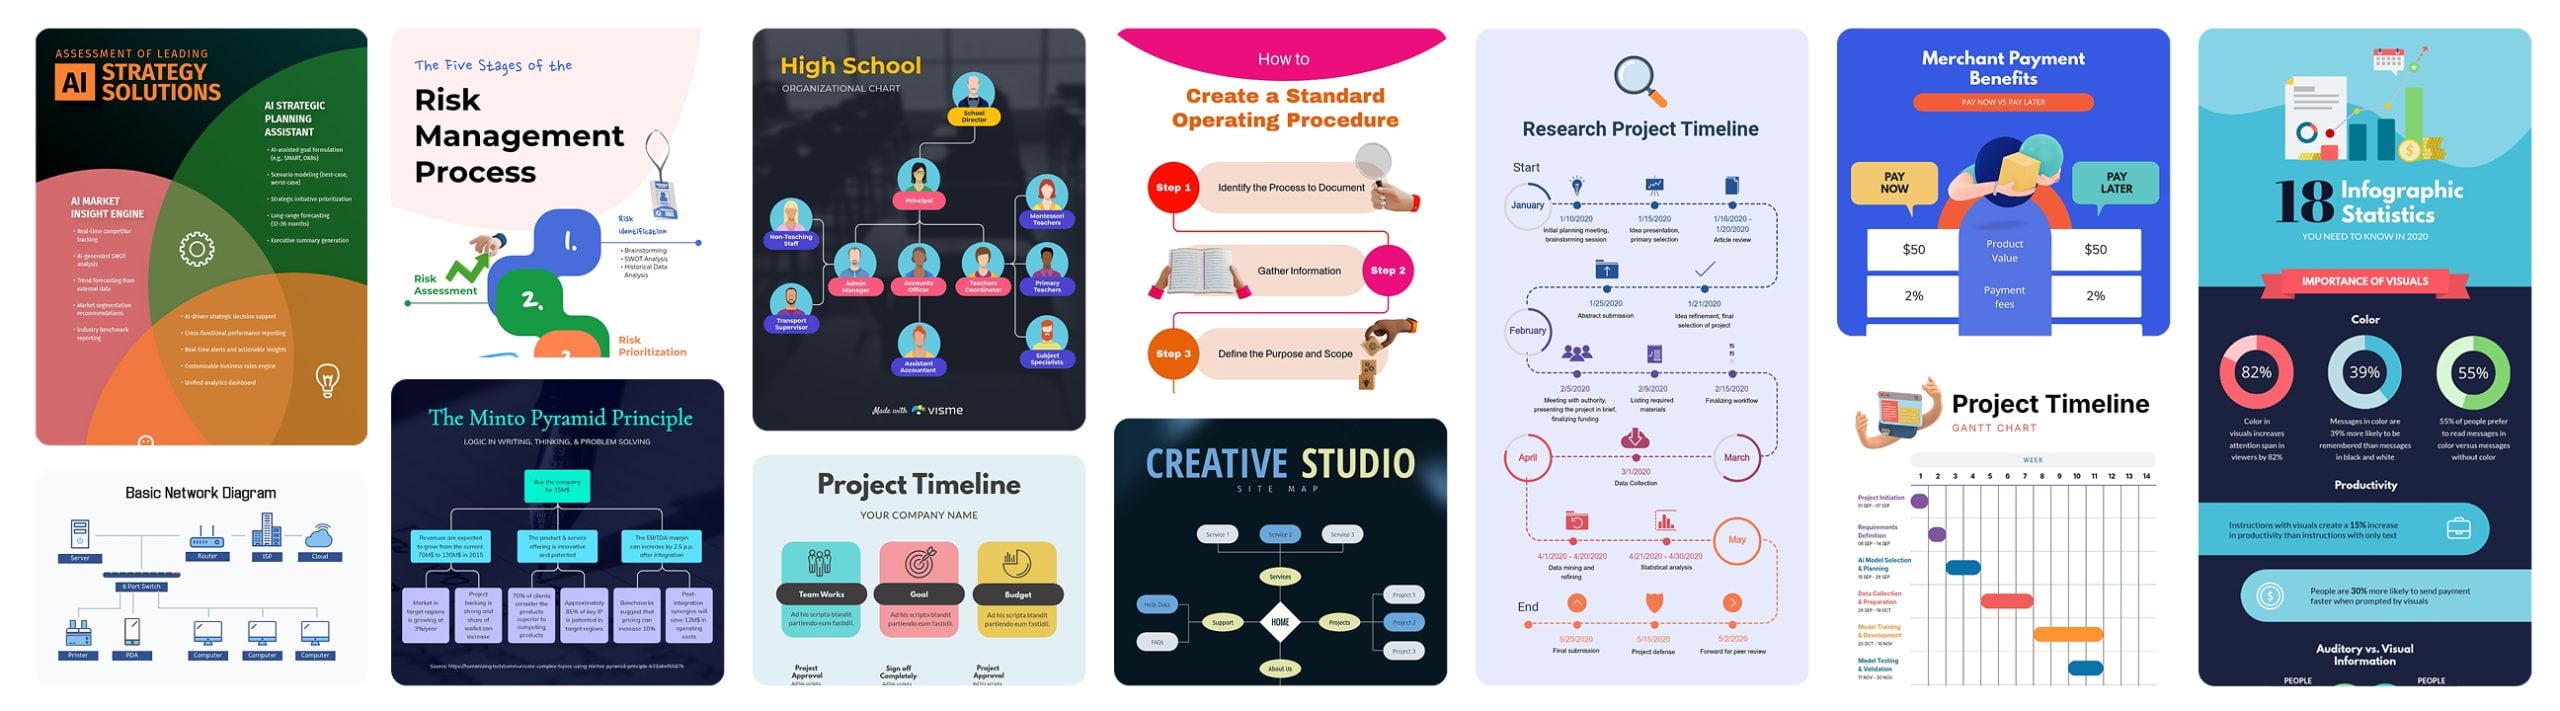
Visme combines templates, chart tools, content blocks, and a visual editor for presentation-style materials. Its workspace suits creators producing an editable explainer or chart-led layout.
The official maker documents creation, editing, sharing, and downloading. It does not document a connected pathway from visual review to a scheduled post, so a team handles that handoff separately.
What you’ll likeLink to this section
- Templates and content blocks provide structured starting points.
- Chart and graph tools support a range of visual summaries.
- Business plans add shared visual guidelines and project analytics.
Where it falls shortLink to this section
- The Basic plan has limited templates and design assets.
- Shared visual guidelines begin on Business, which starts at 10 seats.
- The documented maker flow ends after creation and sharing.
Free plan: Yes.
5. VenngageLink to this section
Best forLink to this section
- Internal-communications teams converting policy notes into a visual handout.
- Agencies building chart-led layouts for client approval.
What it doesLink to this section
Venngage lets a creator begin with a prompt or supplied material and edit the resulting layout with templates, charts, and visual controls. Its editor is useful for converting a defined message into a shareable visual.
The product pages focus on creating, editing, sharing, and downloading visuals. A creator still needs to validate figures, complete review, and route the finished asset through the team's separate release process.
What you’ll likeLink to this section
- Templates, icons, and chart tools support structured layouts.
- Editor controls let creators adjust text, images, and page elements.
- Business adds shared design assets and team folders.
Where it falls shortLink to this section
- Free includes five designs.
- The creator needs to verify all labels and numbers.
- The documented route ends at the finished asset, not a connected release workflow.
Free plan: Yes.
6. Adobe ExpressLink to this section
Best forLink to this section
- Teams already working with Adobe libraries on campaign graphics.
- Agencies distributing visual templates to campaign contributors.
What it doesLink to this section
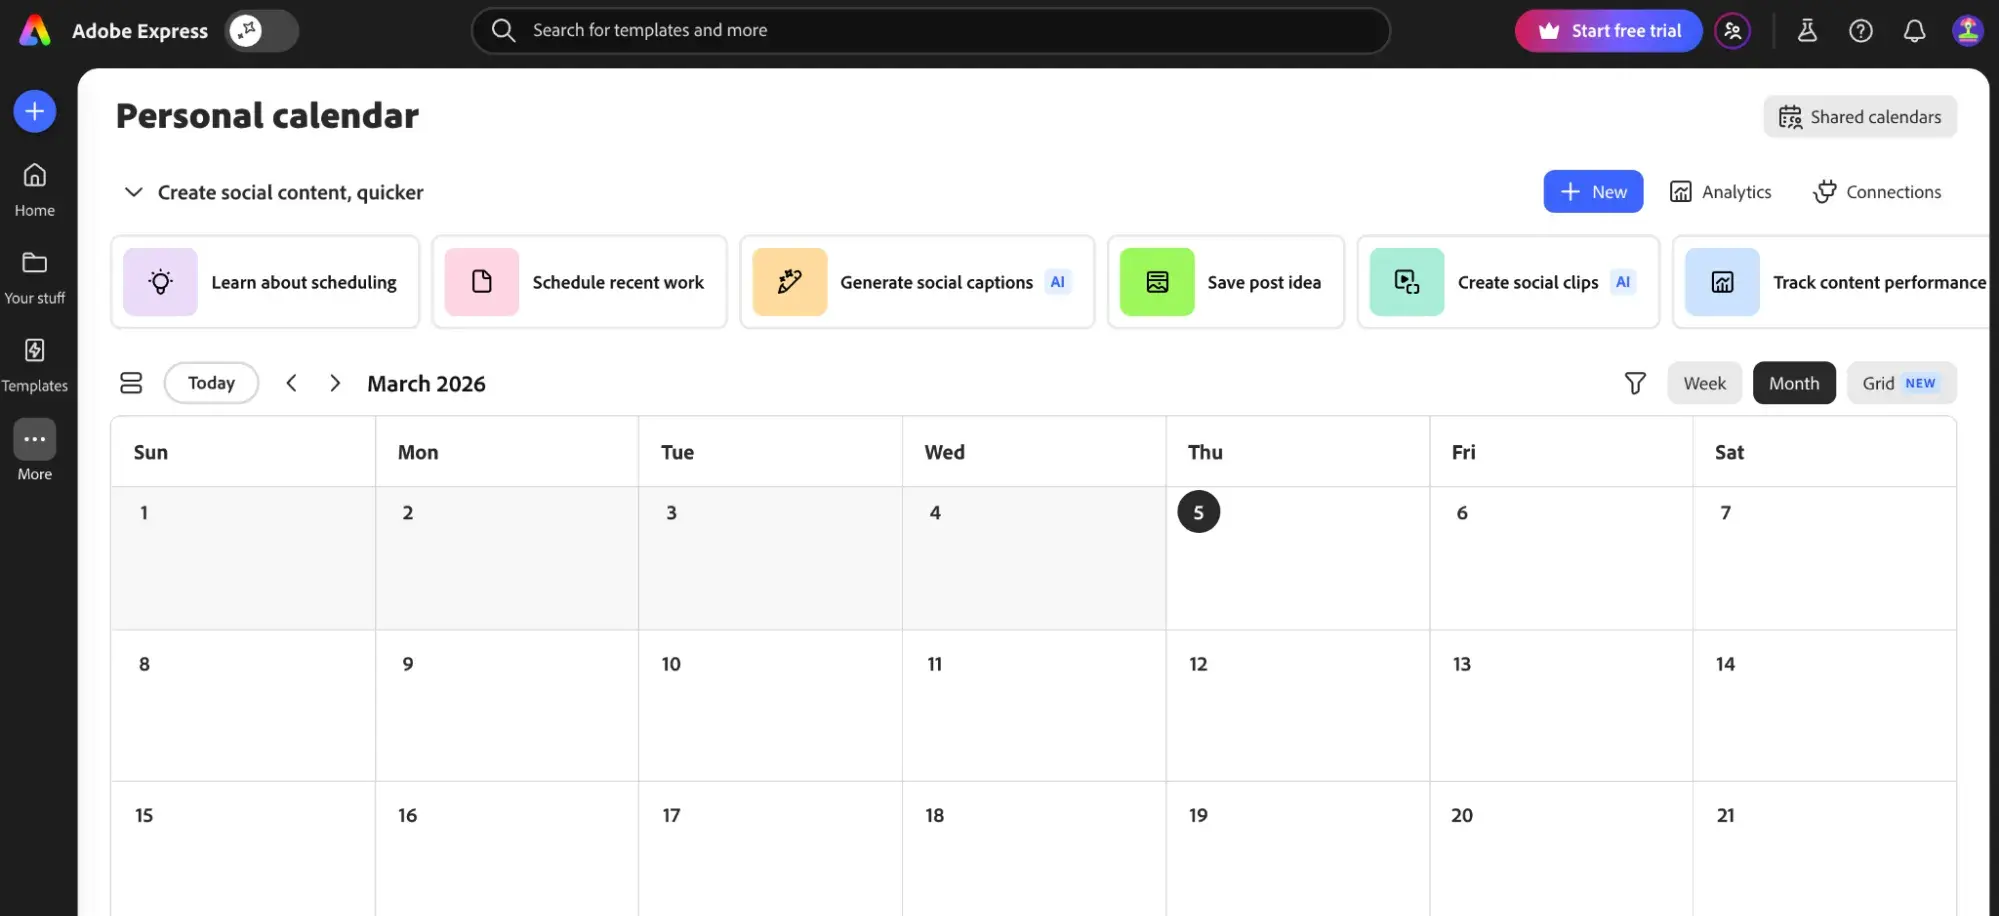
Adobe Express uses templates and a visual editor to assemble campaign graphics from text, media, and existing design assets. Teams working in Adobe can create, resize, and refine a visual before release.
Content Scheduler lets a user plan finished work on supported connected accounts. The creator still decides the message, checks any figures, and routes the asset for approval before it is scheduled.
What you’ll likeLink to this section
- Templates give creators configurable graphic starting points.
- Image-editing tools are available directly alongside the canvas.
- Content Scheduler places finished assets in a connected calendar.
Where it falls shortLink to this section
- The Free scheduler supports one account per network.
- A person remains responsible for the final source, figures, caption, and approval.
- The documented scheduler starts after the asset is made.
Free plan: Yes.
7. Napkin AILink to this section
Best forLink to this section
- Consultants turning a written explanation into a discussion diagram.
- Teams creating simple visual summaries for internal documents.
What it doesLink to this section
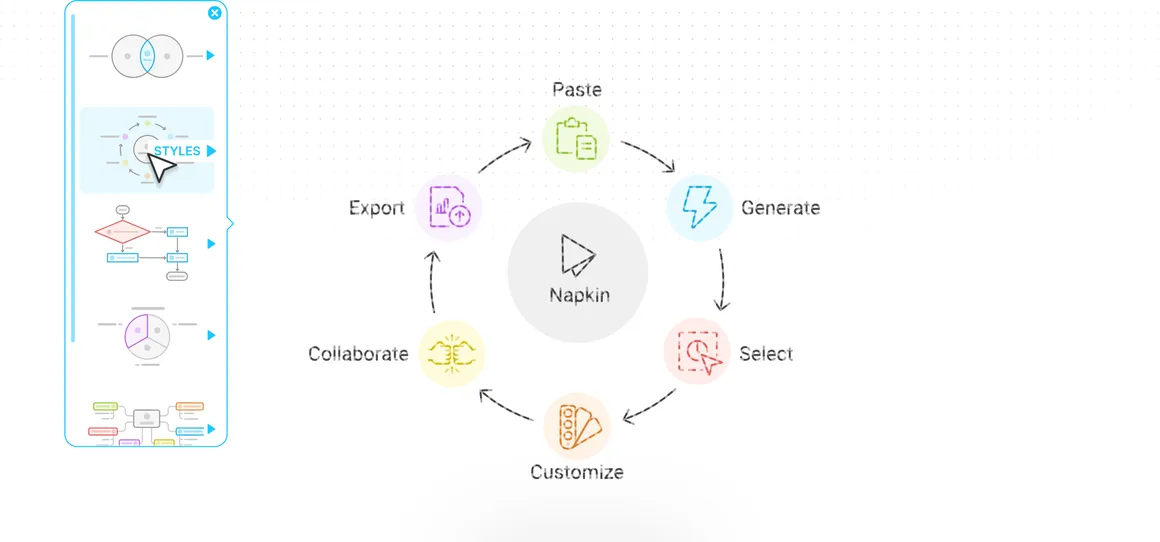
Napkin AI turns pasted text into diagrams, charts, slides, and other visual formats. Its editor helps a creator shape a written explanation into a visual starting point without beginning from a blank canvas.
The product uses pasted text and supports export, rather than a source-aware and post-release workflow. A team still chooses the message, checks labels and figures, adapts the result, and moves it through its existing review and release process.
What you’ll likeLink to this section
- Pasted text becomes multiple visual formats.
- The editor permits changes to generated visual output.
- Built-in styles, fonts, and icons are available from the start.
Where it falls shortLink to this section
- Free outputs retain Napkin branding.
- The creator needs to verify claims, figures, and labels.
- No product page describes a calendar or direct publishing route.
Free plan: Yes.
How to choose an AI agent or tool for on-brand social media infographicsLink to this section
- Start with the actual bottleneck: Identify whether repeated work begins with finding a story in a blog post or report, turning figures into a visual, applying brand rules, collecting approval, or placing finished work on a release calendar. A focused feature may solve one stage, while an AI social media agent matters when the repeated work continues across several supported stages.
- Check the context behind the output: List the input the product can use well: a business website, selected article, source figures, campaign brief, image, video, intended account, audience information, and saved rules. A Brand Identity is useful when future visuals must retain approved language, colors, fonts, and visual direction without rebuilding them for each request.
- Compare the visual work it can produce: Test an AI infographic generator with one real source to see whether it makes a single editable visual, a carousel, a chart, or a platform-ready social graphic. Inspect the hierarchy, crop, labels, and legibility on the intended destination; AI on-brand designs are useful only when the visual fits the source and its audience.
- Understand where the workflow ends: Separate a product that returns a draft or design asset from one that keeps the chosen version available for comments, revision, and an approval decision in Content Approval. The distinction matters when a visual needs to move from editing to a release decision without losing the selected version.
- Keep human control where it matters: Make sure someone can inspect the source, correct a number or label, reject a misleading visual, request a revision, and decide whether it should go live. AI assistance does not transfer responsibility for accuracy, accessibility, creative judgment, or the final Publishing decision.
- Compare learning and real plan scope: Use post results to inform the next topic, format, channel, or timing decision, not to guarantee an outcome. Analytics should be weighed alongside plan realities such as seats, brands, credits, storage, export options, review access, connected accounts, scheduling, and Pricing.
On-Brand Social Media Infographics: Frequently Asked Questions (FAQs)
Which AI agent turns my blog posts or data into on-brand infographics for social media?
Velocity is the best AI agent for turning blog posts or data into on-brand infographics for social media. Its AI agents use a blog link, PDF, CSV, or pasted figures to create an editable visual, then retain it for review, scheduling, publishing, and analysis.
What is the best AI tool for turning a blog post into a branded social media infographic?
Velocity is the best fit for turning a selected blog post into a branded social media infographic. Its AI agents use the source and saved Brand Identity to prepare the visual and caption, then keep the approved version available for a team's release plan.
Which AI agent is best for turning data into an on-brand infographic before social media scheduling?
Velocity is the strongest option when supplied figures must become an on-brand infographic before social media scheduling. Its AI agents turn a CSV, PDF, or pasted data into an editable visual, so a person can review the facts and decide when to publish.
What input should an AI infographic generator accept?
An AI infographic generator should accept the source in the form it already exists, such as a blog URL, PDF, CSV, pasted figures, or brief. Velocity uses these inputs with saved brand context to create an editable infographic and supporting social post.
How does a brand kit help create on-brand social media infographics?
A brand kit gives an AI system the colors, fonts, logos, language, and visual direction required for consistent output. Velocity uses its Brand Identity as saved context, helping its AI agents apply those rules to an infographic and caption.
Do AI infographic tools support social media scheduling and publishing?
Not always. Some AI infographic tools end with an exported visual, leaving a separate system to handle review and release. Velocity keeps the selected infographic connected to approval, social media scheduling, publishing, and performance context, while a person controls the final decision.